


Hi, today I'll be writing a long and detailed article about low-level profiling and performance diagnostics. In the comments to my talks and articles, I've heard users repeatedly express a desire to see not just a list of "do's" and "don'ts" patterns, but a comprehensive history. So here's an article about a specific case and its history ") . Don't be surprised that we'll start with JPA, even though it might seem like a different beast from assembler. You'll understand everything as we go along.
. Don't be surprised that we'll start with JPA, even though it might seem like a different beast from assembler. You'll understand everything as we go along.
Some of the material that formed the basis of this report was previously posted here , so if you suddenly feel like you've read it somewhere before, your instincts are spot on. However, this article isn't plagiarized, but rather a more complete and detailed story explaining the what, how, why, and purpose of it. The source code is available here .
ancient, mammoth-sized, long-running application, which used a standard enterprise data management system: Oracle, Hibernate, and Spring Data JPA. Our application had several large entities (with dozens of fields), and we often needed only a few of them. We solved the problem of extracting a few fields from many (bypassing loading the entire entity and reducing traffic) using DTOs:
// жирная сущность
@entity
public class ManyFieldsEntity {
@Id
private Long id;
@Column
private String extId;
@Column
private String name;
@Column
private BigDecimal amount1;
@Column
private BigDecimal amount2;
@Column
private BigDecimal amount3;
@Column
private BigDecimal amount4;
@Column
private BigDecimal amount5;
@Column
private BigDecimal amount6;
@Column
private BigDecimal amount7;
@Column
private BigDecimal amount8;
}
// DTO
@Getter
@RequiredArgsConstructor
public class HasIdAndNameDto {
private final Long id;
private final String name;
}
// метод для извлечения данных
public interface ManyFieldsRepository extends JpaRepository<ManyFieldsEntity, Long> {
@Query("select new com.tsypanov.domain.HasIdAndNameDto(e.id, e.name)" +
" from ManyFieldsEntity e " +
" where e.name = :name")
Collection<HasIdAndNameDto> findAllByNameUsingDto(String name);
}
I'm sure most of you have written something similar at least once. In our case, one of the developers suggested an alternative: projections.
public interface HasIdAndName {
Long getId();
String getName();
}
This approach has a number of advantages over traditional DTOs:
Collection<HasIdAndName> findAllByName(String name);
}
@State(Scope.Thread)
@OutputTimeUnit(TimeUnit.MICROSECONDS)
@BenchmarkMode(value = Mode.AverageTime)
public class ProjectionVsDtoBenchmark {
private ManyFieldsRepository repository;
@Param({"1", "100"})
private int count;
@Setup
public void init() {
ConfigurableApplicationContext context = SpringApplication.run(Application.class);
context.registerShutdownHook();
repository = context.getBean(ManyFieldsRepository.class);
List<ManyFieldsEntity> entities = ThreadLocalRandom.current()
.longs(count)
.boxed()
.map(randomLong -> new ManyFieldsEntity(randomLong, String.valueOf(randomLong), "ivan"))
.collect(Collectors.toList());
repository.saveAll(entities);
}
//DTO реализует HasIdAndName, поэтому возвращаемый тип тот же
@Benchmark
public Collection<HasIdAndName> dto() {
return repository.findAllByNameUsingDto("ivan");
}
@Benchmark
public Collection<HasIdAndName> projection() {
return repository.findAllByName("ivan");
}
}
It might seem that since we are accessing a database (even if it is H2 on our host), the lion's share of time is spent on the request and data transfer, therefore the numbers will be approximately the same.
However:
Benchmark (count) Score Error Units
dto 1 11,409 ± 0,741 us/op
projection 1 12,886 ± 0,194 us/op
dto 100 40,326 ± 0,738 us/op
projection 100 220,189 ± 5,668 us/op
dto:·gc.alloc.rate.norm 1 13994,528 ± 22,042 B/op
projection:·gc.alloc.rate.norm 1 21224,235 ± 19,369 B/op
dto:·gc.alloc.rate.norm 100 33313,019 ± 22,609 B/op
projection:·gc.alloc.rate.norm 100 517354,738 ± 34,719 B/op
The run's results are somewhat discouraging: while retrieving a single object costs more or less the same, when retrieving 100 objects, the projection-returning method ManyFieldsRepository.findAllByNameUsingDto()starts to lose significantly. This is counterintuitive, since it's the query itself that most often impacts response time. Well, it's time to break out the profiler and find the bottlenecks.
We won't be looking at VisualVM , due to its "popularity" and some inherent flaws. We'll start with JFR, since it can be connected directly from the benchmark (in general, launching from the main method isn't a very "Orthodox" approach; it's more correct to run the benchmark from the command line, but in this case, that's not so important):
public class BenchmarkRunner {
public static void main(String[] args) throws Exception {
Options opt = new OptionsBuilder()
.include(ProjectionProfilingBenchmark.class.getSimpleName())
.warmupIterations(10)
.warmupTime(TimeValue.seconds(1))
.measurementIterations(2) // два длинных прогона
.measurementTime(TimeValue.seconds(15))
.addProfiler(JavaFlightRecorderProfiler.class)
.forks(1) // 1 процесс для стабилизации скомпилированного кода
.shouldFailOnError(true)
.jvmArgsAppend( // допнастройки для правильной работы
"-XX:+UnlockDiagnosticVMOptions",
"-XX:+DebugNonSafepoints"
)
.build();
new Runner(opt).run();
}
}
Please note, the experiment is performed on the "eight" (this is important, you'll understand why later). The run is complete, let's look at the numbers (click on the image for a full-size view):

The key here is that query execution takes only about 6%, while processing the received data accounts for almost 80%. Naturally, when using a production database on a remote host, the ratio will shift toward query execution.
Expanding the method ResultProcessor.processResult()reveals the following:
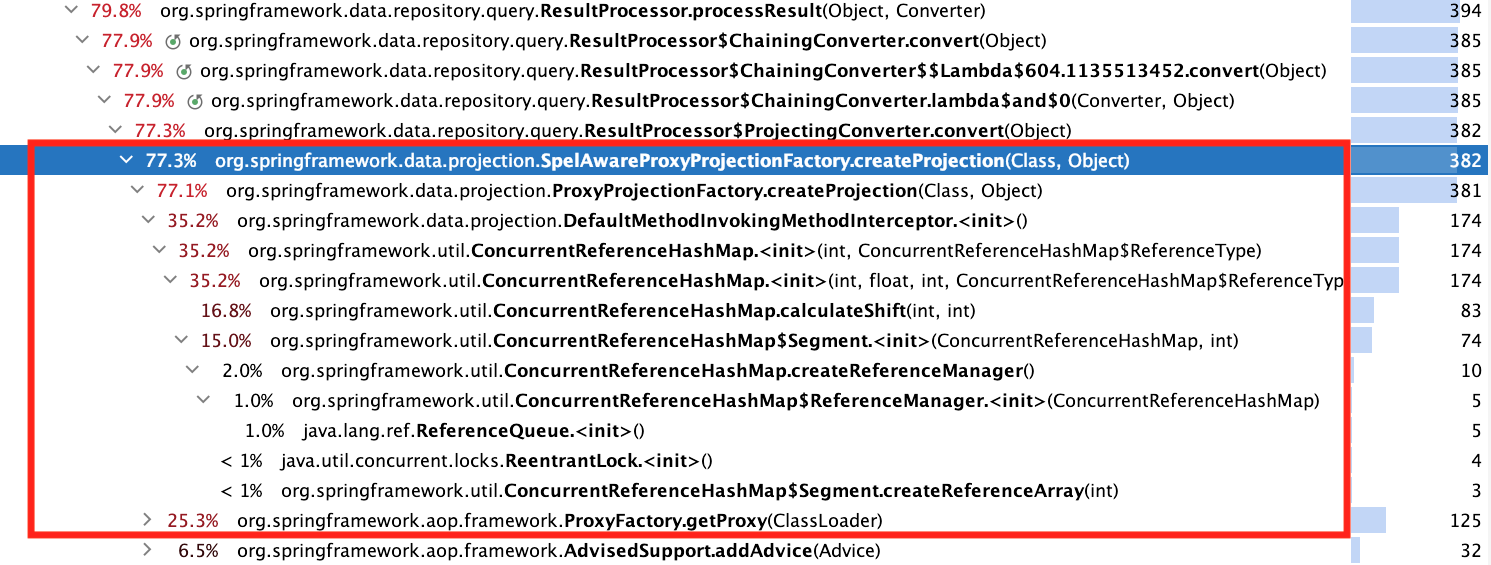
The pumping process ProxyFactory.getProxy()is described here , but it's all too simple and uninteresting. It's better to look at ConcurrentReferenceHashMap: hot methods are the constructor, method calculateShift(), and nested class constructor CRHM$Segment(from here on, the source code CRHMrefers to Spring version 5.1.3). Here they are:
public ConcurrentReferenceHashMap(
int initialCapacity, float loadFactor, int concurrencyLevel, ReferenceType referenceType) {
Assert.isTrue(initialCapacity >= 0, "Initial capacity must not be negative");
Assert.isTrue(loadFactor > 0f, "Load factor must be positive");
Assert.isTrue(concurrencyLevel > 0, "Concurrency level must be positive");
Assert.notNull(referenceType, "Reference type must not be null");
this.loadFactor = loadFactor;
this.shift = calculateShift(concurrencyLevel, MAXIMUM_CONCURRENCY_LEVEL);
int size = 1 << this.shift;
this.referenceType = referenceType;
int roundedUpSegmentCapacity = (int) ((initialCapacity + size - 1L) / size);
this.segments = (Segment[]) Array.newInstance(Segment.class, size);
for (int i = 0; i < this.segments.length; i++) {
this.segments = new Segment(roundedUpSegmentCapacity);
}
}
public Segment(int initialCapacity) {
this.referenceManager = createReferenceManager();
this.initialSize = 1 << calculateShift(initialCapacity, MAXIMUM_SEGMENT_SIZE);
this.references = createReferenceArray(this.initialSize);
this.resizeThreshold = (int) (this.references.length * getLoadFactor());
}
protected static int calculateShift(int minimumValue, int maximumValue) {
int shift = 0;
int value = 1;
while (value < minimumValue && value < maximumValue) {
value <<= 1;
shift++;
}
return shift;
}
The first thing that raises doubts about the reliability of these figures is the share calculateShift(). It's doubtful that such a simple calculation method really accounts for almost 17%.
We need greater precision, so async-profiler comes to the rescue . Let's simplify the benchmark to profile only the creation CRHM:
@OutputTimeUnit(TimeUnit.NANOSECONDS)
@BenchmarkMode(value = Mode.AverageTime)
public class CRHMBenchmark {
@Benchmark
public Object instantiate() {
return new ConcurrentReferenceHashMap<>();
}
}
Let's add it to our benchmark settings and connect it AsyncProfiler:
public class BenchmarkRunner {
public static void main(String[] args) throws Exception {
Options opt = new OptionsBuilder()
.include(CRHMBenchmark.class.getSimpleName())
.warmupIterations(10)
.warmupTime(TimeValue.seconds(1))
.measurementIterations(10)
.measurementTime(TimeValue.seconds(1))
.addProfiler(AsyncProfiler.class)
.forks(1)
.shouldFailOnError(true)
.build();
new Runner(opt).run();
}
}
Please note that in this case, we no longer need to specify additional VM settings; they are added automatically in the method AsyncProfiler.addJVMOptions(). Let's look at the output:
ns percent samples top
---------- ------- ------- ---
4270110916 27.81% 427 o.s.u.ConcurrentReferenceHashMap$Segment.<init>
3920827445 25.53% 392 o.s.u.ConcurrentReferenceHashMap$ReferenceManager.<init>
3691037002 24.04% 369 o.s.u.ConcurrentReferenceHashMap.createReferenceManager
1719959854 11.20% 172 o.s.u.ConcurrentReferenceHashMap.<init>
439959922 2.87% 44 java.lang.ref.ReferenceQueue.<init>
279927288 1.82% 28 java.util.concurrent.locks.ReentrantLock.<init>
70590822 0.46% 7 smp_call_function_single_[k]
As expected, [] disappeared from the profile calculateShift(), although this didn't add any clarity. A code review reveals one possible improvement: since the constructor argument Segment(int)is always the same for the entire loop in the constructor CRHM, the expression 1 << calculateShift(initialCapacity, MAXIMUM_SEGMENT_SIZE)can be evaluated only once. This won't provide a significant improvement.
So, we're at a dead end: the source code for hot methods is small, and it's impossible to find a clue to the problem just by looking. JFR and async-profiler only provide a rough direction for searching, but pinpointing the exact line will require a more precise, low-level tool.
public class BenchmarkRunner {
public static void main(String[] args) throws Exception {
Options opt = new OptionsBuilder()
.include(CRHMBenchmark.class.getSimpleName())
.warmupIterations(10)
.warmupTime(TimeValue.seconds(1))
.measurementIterations(1) // одного длинного прогона достаточно
.measurementTime(TimeValue.seconds(10))
.addProfiler(LinuxPerfAsmProfiler.class)
.forks(1) // важно!
.shouldFailOnError(true)
.jvmArgsAppend(
"-XX:+UnlockDiagnosticVMOptions",
"-XX:+PrintAssembly"
)
.build();
new Runner(opt).run();
}
}
Please note: using this profiler requires some preparatory work, which I described in one of the previous articles .
Also, the presence of 1 process here is decisive, because different processes will most likely have different command addresses, this is separately stated in the documentation .
// строка 78
4.82% 0x00007f137d227722: mov 0x8(%rsp),%r14
The reader is probably scratching their head and thinking, "Hmm, what am I supposed to see here?" I admit, I stared at this for a long time without a single coherent thought until @apangin pointed out that perf often shifts hot spots in the output. This unpleasant phenomenon is called performance event skid and is defined as follows:
For us, this means we need to look somewhere around the hot lines:
0.44% 0x00007f137d22771b: mov %r10,%r13 ;*getfield segments
; - o.s.u.CRHM::<init>@121 (line 183)
0x00007f137d22771e: mov (%rsp),%r9d
4.82% 0x00007f137d227722: mov 0x8(%rsp),%r14
0.11% 0x00007f137d227727: mov 0x10(%rsp),%rsi
0x00007f137d22772c: mov 0x18(%rsp),%r11
0x00007f137d227731: mov 0x20(%rsp),%r8
0.66% 0x00007f137d227736: mov 0x30(%rsp),%rdi ;*aload_0
; - o.s.u.CRHM::<init>@128 (line 184)
The bytecode getfieldmeans reading a field, in this case segments, on line 183:
for (int i = 0; i < this.segments.length; i++) {
this.segments = new Segment(roundedUpSegmentCapacity);
}
Why so many, and why didn't the execution optimize access in such simple code? To answer this question, we need to look at other hot instructions:
// строка 124
18.29% 0x00007f137d2277e4: mov 0x60(%r15),%rdx
It's no clearer here than in the first example, let's look around:
0.99% 0x00007f137d2277d7: mov %r12l,(%r10,%rcx)
0x00007f137d2277db: mov %r12d,0x14(%rbx)
0x00007f137d2277df: lock addl $0x0,(%rsp) ;*putfield count
; - o.s.u.CRHM$Segment::<init>@11 (line 476)
; - o.s.u.CRHM::<init>@141 (line 184)
18.29% 0x00007f137d2277e4: mov 0x60(%r15),%rdx
0x00007f137d2277e8: mov %rdx,%r10
0x00007f137d2277eb: add $0x18,%r10
0.55% 0x00007f137d2277ef: cmp 0x70(%r15),%r10
Interestingly, a whole 18.29% is taken up by the entry in the field countin line 476:
protected final class Segment extends ReentrantLock {
private volatile int count = 0;
}
Looks like it's a bull's eye! We're writing 0 to an integer field, which by specification is simply 0 (and all this in a loop). And that 18.29% is being inflated by that nasty guy volatile:
@OutputTimeUnit(TimeUnit.NANOSECONDS)
@BenchmarkMode(value = Mode.AverageTime)
public class VolatileFieldZeroingBenchmark {
@Benchmark
public Object explicitInit() {
return new Class1();
}
@Benchmark
public Object defaultInit() {
return new Class2();
}
private static class Class1 {
private volatile boolean field = false;
}
private static class Class2 {
private volatile boolean field;
}
}
In both cases, after creating the object, the value of the fields will be false, but with explicit assignment the cost is significantly higher:
Benchmark Score Error Units
VolatileFieldZeroingBenchmark.explicitInit 11.200 ± 0.270 ns/op
VolatileFieldZeroingBenchmark.defultInit 3.447 ± 0.208 ns/op
Writing to a volatile field forces the compiler to insert instructions to ensure sequential consistency according to the memory model. In our case, this is the instruction lock addl $0x0,(%rsp), which is the barrier implementation StoreLoad. Memorizing these low-level implementation details is not necessary (they may change over time); understanding the high-level patterns is important.
It turns out that nothing prevents us from replacing the expression
private volatile int count = 0;
expression
private volatile int count;
Or does it actually interfere? Alexey Shipilev posed this question in a well-known multithreading mailing list . I strongly recommend a thoughtful reading as an example of how to make assumptions about how multithreaded code and the memory model will behave.
Doug Lee put the finishing touches :
@OutputTimeUnit(TimeUnit.NANOSECONDS)
@BenchmarkMode(value = Mode.AverageTime)
public class AtomicZeroingBenchmark {
@Benchmark
public Object defaultValue() {
return new AtomicInteger();
}
@Benchmark
public Object explicitValue() {
return new AtomicInteger(0);
}
}
The first method is expected to work faster:
Benchmark Mode Cnt Score Error Units
AtomicZeroingBenchmark.defaultValue avgt 20 3,037 ± 0,100 ns/op
AtomicZeroingBenchmark.explicitValue avgt 20 13,976 ± 0,220 ns/op
Here are some examples from life: one , two , three .
Now let's return to the assembler. We find similar code below:
// строка 192
0x00007f137d2278c9: lock addl $0x0,(%rsp) ;*putfield head
; - java.lang.ref.ReferenceQueue::<init>@18 (line 56)
; - o.s.u.CRHM$ReferenceManager::<init>@14 (line 984)
; - o.s.u.CRHM::createReferenceManager@5 (line 207)
; - o.s.u.CRHM$Segment::<init>@16 (line 485)
; - o.s.u.CRHM::<init>@141 (line 184)
17.31% 0x00007f137d2278ce: mov %r10d,0xc(%rdx) ;*putfield queue
; - o.s.u.CRHM$ReferenceManager::<init>@17 (line 984)
; - o.s.u.CRHM::createReferenceManager@5 (line 207)
; - o.s.u.CRHM$Segment::<init>@16 (line 485)
; - o.s.u.CRHM::<init>@141 (line 184)
0x00007f137d2278d2: mov %r12,0x10(%rbp) ;*putfield queueLength
The symptoms are the same, and the culprit is java.lang.ref.ReferenceQueue:
public class ReferenceQueue<T> {
private volatile Reference<? extends T> head = null;
}
Since it's a JDK class, there's nothing we can do with it (this is fixed in Java 9+ ).
Let's move on. At the very end of the assembly code, we find the following section:
8.00% 0x00007f137d22766a: mov %rbp,%r8
0.22% 0x00007f137d22766d: mov %r10d,0x20(%rbp)
0x00007f137d227671: mov %rbp,%r10
0.66% 0x00007f137d227674: shr $0x9,%r10
0x00007f137d227678: movabs $0x7f138fec8000,%r11
0x00007f137d227682: mov %r12l,(%r11,%r10)
0x00007f137d227686: lock addl $0x0,(%rsp) ;*putfield references
; - o.s.u.CRHM$Segment::<init>@43 (line 487)
; - o.s.u.CRHM::<init>@141 (line 184)
10.51% 0x00007f137d22768b: mov 0x20(%rbp),%r11d ;*getfield references
; - o.s.u.CRHM$Segment::<init>@48 (line 488)
; - o.s.u.CRHM::<init>@141 (line 184)
0.11% 0x00007f137d22768f: mov 0xc(%r11),%r10d ;*arraylength
; - o.s.u.CRHM$Segment::<init>@51 (line 488)
; - o.s.u.CRHM::<init>@141 (line 184)
; implicit exception: dispatches to 0x00007f137d227e91
Here 8% is occupied by the same one lock addl $0x0,(%rsp), corresponding to the entry in the volatile field in the constructor Segment:
protected final class Segment extends ReentrantLock {
private volatile Reference<K, V>[] references;
public Segment(int initialCapacity) {
this.references = createReferenceArray(this.initialSize);
}
}
volatileIt's needed here for proper operation in a multithreaded environment, so we'll skip it, but the 10.51% corresponding to the bytecode arraylengthon line 488 is worth a closer look:
protected final class Segment extends ReentrantLock {
private volatile Reference<K, V>[] references;
public Segment(int initialCapacity) {
this.references = createReferenceArray(this.initialSize);
this.resizeThreshold = (int) (this.references.length * getLoadFactor());
}
}
Since we're reading from a volatile field, reading is more expensive than usual. A solution here might be to create a local variable that stores the array returned from createReferenceArray, and then assign and read from it.
Comment
The presence of volatile accesses within the loop, as well as array access via a field reference, made access quite expensive. This access is precisely what triggers the very first hot section of the assembler:
for (int i = 0; i < this.segments.length; i++) { // читаем из поля
this.segments = new Segment(roundedUpSegmentCapacity); // пишем в поле
}
What to do with this is described in detail in the article mentioned at the very beginning , so I will not dwell on this in detail.
The full conclusion is here , and after skimming through it we suddenly discover that all mention has disappeared from it putfield count.
When I first realized this, I thought the optimizing compiler in later versions had become so sophisticated that it could recognize and discard the unnecessary assignment of a default value to a volatile field. But I still decided to double-check and search lock addl $0x0. And this instruction was still there:
╭ 0x00007f5408368ff5: jmp 0x7f5408369004
│ 0x00007f5408368ff7: mov %rdi,0xfffffffffffffff8(%r10,%r9)
│ ;*putfield sync {reexecute=0 rethrow=0 return_oop=0}
│ ; - j.u.c.l.ReentrantLock::<init>@12 (line 239)
│ ; - o.s.u.CRHM$Segment::<init>@6 (line 484)
│ ; - o.s.u.CRHM::<init>@141 (line 184)
│ 0x00007f5408368ffc: add $0xfffffffffffffff8,%r9
│ 0x00007f5408369000: mov %r9,0x70(%r15)
0.87% ↘ 0x00007f5408369004: movl $0x0,0x14(%rbx)
0.05% 0x00007f540836900b: lock addl $0x0,0xffffffffffffffc0(%rsp)
24.08% 0x00007f5408369011: mov 0x118(%r15),%r13
0x00007f5408369018: mov %r13,%r10
As before, it is executed after calling the constructor ReentrantLockof which is a child class ConcurrentReferenceHashMap$Segment. The main difficulty is that if a developer starts profiling on Java 11 or higher, they simply won't see a reference to a specific line in the Java source code!
I didn't have a complete understanding of what was going on, so I asked a question .
It turned out that optimizations and permutations in JIT execution broke the correlation between the compiled code and the source code. However, there is a solution: by running the code with a flag -XX:MaxInlineLevel=0(disables pasting), we get what we need:
0.99% 0x00007fc53836b418: movl $0x0,0x14(%rbp)
0x00007fc53836b41f: lock addl $0x0,0xffffffffffffffc0(%rsp)
;*putfield count {reexecute=0 rethrow=0 return_oop=0}
; - o.s.u.CRHM$Segment::<init>@11 (line 476)
; - o.s.u.CRHM::<init>@141 (line 184)
18.78% 0x00007fc53836b425: mov (%rsp),%rsi
0.10% 0x00007fc53836b429: nop
This is obviously a poor solution, since the embedding depth in production code will differ from that used in experiments. It seems I should write to the hotspot-compiler-dev mailing list . The response was not long in coming:
.
Comment
I strongly advise against using the described workaround for this limitation ( -XX:MaxInlineLevel=0) as the sole diagnostic tool, as disabling pasting can significantly distort the profile. This can be demonstrated with a simple example:
@BenchmarkMode(Mode.AverageTime)
@OutputTimeUnit(TimeUnit.NANOSECONDS)
public class TurnOffInliningBenchmark {
@Benchmark
public int calculate() {
return calculate(200);
}
@Benchmark
@Fork(jvmArgsAppend = {"-XX:MaxInlineLevel=0"})
public int calculateNoInlining() {
return calculate(200);
}
private Integer calculate(int length) {
Integer sum = 0;
for (int i = 0; i < length; i++) {
sum += i;
}
return sum;
}
}
If you run this benchmark on older versions (for example, 17), the method calculateNoInlining()will lose by a huge margin in both time and memory consumption:
Benchmark Score Error Units
TurnOffInliningBenchmark.calculate 51,099 ± 0,842 ns/op
TurnOffInliningBenchmark.calculate:·gc.alloc.rate 0,001 ± 0,001 MB/sec
TurnOffInliningBenchmark.calculate:·gc.alloc.rate.norm ≈ 10⁻⁴ B/op
TurnOffInliningBenchmark.calculate:·gc.count ≈ 0 counts
TurnOffInliningBenchmark.calculateNoInlining 766,289 ± 17,697 ns/op
TurnOffInliningBenchmark.calculateNoInlining:·gc.alloc.rate 2443,419 ± 54,399 MB/sec
TurnOffInliningBenchmark.calculateNoInlining:·gc.alloc.rate.norm 2944,301 ± 0,014 B/op
TurnOffInliningBenchmark.calculateNoInlining:·gc.churn.G1_Eden_Space 2437,723 ± 70,539 MB/sec
TurnOffInliningBenchmark.calculateNoInlining:·gc.churn.G1_Eden_Space.norm 2937,362 ± 52,498 B/op
TurnOffInliningBenchmark.calculateNoInlining:·gc.churn.G1_Survivor_Space 0,015 ± 0,002 MB/sec
TurnOffInliningBenchmark.calculateNoInlining:·gc.churn.G1_Survivor_Space.norm 0,018 ± 0,003 B/op
TurnOffInliningBenchmark.calculateNoInlining:·gc.count 596,000 counts
TurnOffInliningBenchmark.calculateNoInlining:·gc.time 469,000 ms
The profile will, of course, be greatly distorted.
0.97% ↘ 0x00007f6ff436a099: mov 0x10(%rsp),%r10
0.05% 0x00007f6ff436a09e: movl $0x0,0x14(%r10)
0x00007f6ff436a0a6: lock addl $0x0,0xffffffffffffffc0(%rsp)
;*putfield count {reexecute=0 rethrow=0 return_oop=0}
; - o.s.u.CRHM$Segment::<init>@11 (line 476)
25.36% 0x00007f6ff436a0ac: mov 0x8(%rsp),%r10
At this point, I was completely at a loss. After a few more runs, the picture became a bit clearer: the indication of a putfield countfailure appeared randomly in the output when running in normal mode (in other words, without any additional VM configuration). Then I decided to collect some statistics:
#!/bin/bash
for i in {1..100}
do
touch "$i".txt
/usr/lib/jvm/java-11-openjdk-amd64/bin/java \
-jar ../target/benchmarks.jar CRHMBenchmark \
-f 1 -wi 5 -i 1 -w 1s -r 1s -prof perfasm \
-jvmArgsAppend "-XX:+UnlockDiagnosticVMOptions -XX:+PrintAssembly" > "$i".txt
done
In this script, we perform 100 runs and write the output of each to a separate file. Then, we go to the file folder and count the number of occurrences of the search string:
#!/bin/bash
declare -i count=0;
declare -i count_in_file=0;
for i in *.txt;
do
count_in_file=$((`grep -o -i 'putfield count' $i | wc -l`));
count=$((count + count_in_file));
done
echo $count
This is what I got:
0.90% 0x00007f2513331eae: lock addl $0x0,-0x40(%rsp) ;*putfield count {reexecute=0 rethrow=0 return_oop=0}
0.03% 0x00007fc1bbb924ab: lock addl $0x0,-0x40(%rsp) ;*putfield count {reexecute=0 rethrow=0 return_oop=0}
0.07% 0x00007f9972d021ae: lock addl $0x0,-0x40(%rsp) ;*putfield count {reexecute=0 rethrow=0
...
0.42% 0x00007f99b03999ae: lock addl $0x0,-0x40(%rsp) ;*putfield count {reexecute=0 rethrow=0 return_oop=0}
24
Simply put, in 24 cases out of 100, the compiler preserved the reference to putfield count. Not very encouraging, right? So, you can never rely on a single run! After all, some data might get lost, and you simply won't see the reference to the hot spot in the Java source code. Therefore, I recommend running 10-20 runs with output to a file and reviewing each one separately.
J8 SB 2.1.1 J8 SB 2.3.11 J11 SB 2.3.11
count Units
dto 1 14.0 ± 0.1 5.8 ± 0.3 6.2 ± 0.1 us/op
proj 1 17.2 ± 0.2 10.3 ± 0.2 10.1 ± 0.0 us/op
dto 100 45.6 ± 0.7 35.0 ± 0.2 31.0 ± 0.5 us/op
proj 100 216.9 ± 0.4 199.6 ± 0.5 180.8 ± 0.8 us/op
Here J8 and J11 are Java 8/11, and SB is Spring Boot of the corresponding version.
. Don't be surprised that we'll start with JPA, even though it might seem like a different beast from assembler. You'll understand everything as we go along.Some of the material that formed the basis of this report was previously posted here , so if you suddenly feel like you've read it somewhere before, your instincts are spot on. However, this article isn't plagiarized, but rather a more complete and detailed story explaining the what, how, why, and purpose of it. The source code is available here .
Story
We were once tasked with developing new functionality for our rather large and// жирная сущность
@entity
public class ManyFieldsEntity {
@Id
private Long id;
@Column
private String extId;
@Column
private String name;
@Column
private BigDecimal amount1;
@Column
private BigDecimal amount2;
@Column
private BigDecimal amount3;
@Column
private BigDecimal amount4;
@Column
private BigDecimal amount5;
@Column
private BigDecimal amount6;
@Column
private BigDecimal amount7;
@Column
private BigDecimal amount8;
}
// DTO
@Getter
@RequiredArgsConstructor
public class HasIdAndNameDto {
private final Long id;
private final String name;
}
// метод для извлечения данных
public interface ManyFieldsRepository extends JpaRepository<ManyFieldsEntity, Long> {
@Query("select new com.tsypanov.domain.HasIdAndNameDto(e.id, e.name)" +
" from ManyFieldsEntity e " +
" where e.name = :name")
Collection<HasIdAndNameDto> findAllByNameUsingDto(String name);
}
I'm sure most of you have written something similar at least once. In our case, one of the developers suggested an alternative: projections.
What are they and what do you eat them with?
A projection is a representation of a part of an entity using an interface with getters corresponding to the field names:public interface HasIdAndName {
Long getId();
String getName();
}
This approach has a number of advantages over traditional DTOs:
- Interfaces themselves are a more flexible tool than classes. By implementing an interface in the above entity and DTO, you can write a service method that works equally well with the entity, the projection, and the DTO.
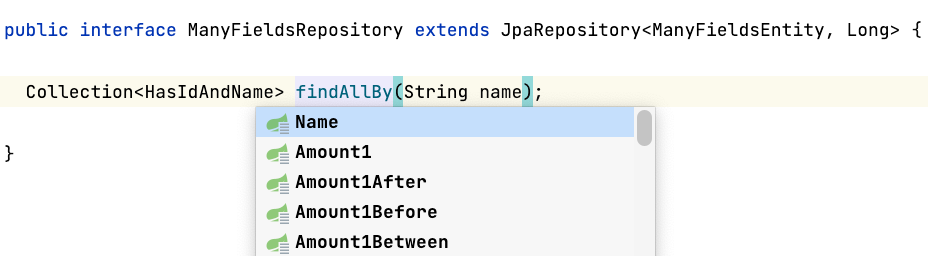
- Declaring a method within a repository no longer requires an explicit constructor declaration, which greatly simplifies matters (especially when the DTO constructor has 10 arguments instead of 1-2), and also allows you to completely eliminate the @Queryneed for a properly named method (Spring will create the query automatically). This allows the code to be written more concisely:
Collection<HasIdAndName> findAllByName(String name);
}
- Idea supports projections and provides hints when writing repository methods, reducing the likelihood of writing a broken query that will only fail when accessed. Furthermore, interface refactoring will not affect the repository method itself (in older versions of Idea, renaming, adding, or removing fields in DTOs did not affect their use in JPQL queries ; highlighting did not always work if the argument order in the constructor was incorrect, etc.).

A fly in the ointment
You've probably already guessed that this huge barrel of honey has a fly in the ointment: poor performance. Let's compare the response time when unloading 1 and 100 DTOs/projections using a simple benchmark:@State(Scope.Thread)
@OutputTimeUnit(TimeUnit.MICROSECONDS)
@BenchmarkMode(value = Mode.AverageTime)
public class ProjectionVsDtoBenchmark {
private ManyFieldsRepository repository;
@Param({"1", "100"})
private int count;
@Setup
public void init() {
ConfigurableApplicationContext context = SpringApplication.run(Application.class);
context.registerShutdownHook();
repository = context.getBean(ManyFieldsRepository.class);
List<ManyFieldsEntity> entities = ThreadLocalRandom.current()
.longs(count)
.boxed()
.map(randomLong -> new ManyFieldsEntity(randomLong, String.valueOf(randomLong), "ivan"))
.collect(Collectors.toList());
repository.saveAll(entities);
}
//DTO реализует HasIdAndName, поэтому возвращаемый тип тот же
@Benchmark
public Collection<HasIdAndName> dto() {
return repository.findAllByNameUsingDto("ivan");
}
@Benchmark
public Collection<HasIdAndName> projection() {
return repository.findAllByName("ivan");
}
}
It might seem that since we are accessing a database (even if it is H2 on our host), the lion's share of time is spent on the request and data transfer, therefore the numbers will be approximately the same.
However:
Benchmark (count) Score Error Units
dto 1 11,409 ± 0,741 us/op
projection 1 12,886 ± 0,194 us/op
dto 100 40,326 ± 0,738 us/op
projection 100 220,189 ± 5,668 us/op
dto:·gc.alloc.rate.norm 1 13994,528 ± 22,042 B/op
projection:·gc.alloc.rate.norm 1 21224,235 ± 19,369 B/op
dto:·gc.alloc.rate.norm 100 33313,019 ± 22,609 B/op
projection:·gc.alloc.rate.norm 100 517354,738 ± 34,719 B/op
The run's results are somewhat discouraging: while retrieving a single object costs more or less the same, when retrieving 100 objects, the projection-returning method ManyFieldsRepository.findAllByNameUsingDto()starts to lose significantly. This is counterintuitive, since it's the query itself that most often impacts response time. Well, it's time to break out the profiler and find the bottlenecks.
We won't be looking at VisualVM , due to its "popularity" and some inherent flaws. We'll start with JFR, since it can be connected directly from the benchmark (in general, launching from the main method isn't a very "Orthodox" approach; it's more correct to run the benchmark from the command line, but in this case, that's not so important):
public class BenchmarkRunner {
public static void main(String[] args) throws Exception {
Options opt = new OptionsBuilder()
.include(ProjectionProfilingBenchmark.class.getSimpleName())
.warmupIterations(10)
.warmupTime(TimeValue.seconds(1))
.measurementIterations(2) // два длинных прогона
.measurementTime(TimeValue.seconds(15))
.addProfiler(JavaFlightRecorderProfiler.class)
.forks(1) // 1 процесс для стабилизации скомпилированного кода
.shouldFailOnError(true)
.jvmArgsAppend( // допнастройки для правильной работы
"-XX:+UnlockDiagnosticVMOptions",
"-XX:+DebugNonSafepoints"
)
.build();
new Runner(opt).run();
}
}
Please note, the experiment is performed on the "eight" (this is important, you'll understand why later). The run is complete, let's look at the numbers (click on the image for a full-size view):
The key here is that query execution takes only about 6%, while processing the received data accounts for almost 80%. Naturally, when using a production database on a remote host, the ratio will shift toward query execution.
Expanding the method ResultProcessor.processResult()reveals the following:
- 77% is spent on creating projections
- 35% is occupied by the designerConcurrentReferenceHashMap
- 25% occupiesProxyFactory.getProxy()
The pumping process ProxyFactory.getProxy()is described here , but it's all too simple and uninteresting. It's better to look at ConcurrentReferenceHashMap: hot methods are the constructor, method calculateShift(), and nested class constructor CRHM$Segment(from here on, the source code CRHMrefers to Spring version 5.1.3). Here they are:
public ConcurrentReferenceHashMap(
int initialCapacity, float loadFactor, int concurrencyLevel, ReferenceType referenceType) {
Assert.isTrue(initialCapacity >= 0, "Initial capacity must not be negative");
Assert.isTrue(loadFactor > 0f, "Load factor must be positive");
Assert.isTrue(concurrencyLevel > 0, "Concurrency level must be positive");
Assert.notNull(referenceType, "Reference type must not be null");
this.loadFactor = loadFactor;
this.shift = calculateShift(concurrencyLevel, MAXIMUM_CONCURRENCY_LEVEL);
int size = 1 << this.shift;
this.referenceType = referenceType;
int roundedUpSegmentCapacity = (int) ((initialCapacity + size - 1L) / size);
this.segments = (Segment[]) Array.newInstance(Segment.class, size);
for (int i = 0; i < this.segments.length; i++) {
this.segments = new Segment(roundedUpSegmentCapacity);
}
}
public Segment(int initialCapacity) {
this.referenceManager = createReferenceManager();
this.initialSize = 1 << calculateShift(initialCapacity, MAXIMUM_SEGMENT_SIZE);
this.references = createReferenceArray(this.initialSize);
this.resizeThreshold = (int) (this.references.length * getLoadFactor());
}
protected static int calculateShift(int minimumValue, int maximumValue) {
int shift = 0;
int value = 1;
while (value < minimumValue && value < maximumValue) {
value <<= 1;
shift++;
}
return shift;
}
The first thing that raises doubts about the reliability of these figures is the share calculateShift(). It's doubtful that such a simple calculation method really accounts for almost 17%.
We need greater precision, so async-profiler comes to the rescue . Let's simplify the benchmark to profile only the creation CRHM:
@OutputTimeUnit(TimeUnit.NANOSECONDS)
@BenchmarkMode(value = Mode.AverageTime)
public class CRHMBenchmark {
@Benchmark
public Object instantiate() {
return new ConcurrentReferenceHashMap<>();
}
}
Let's add it to our benchmark settings and connect it AsyncProfiler:
public class BenchmarkRunner {
public static void main(String[] args) throws Exception {
Options opt = new OptionsBuilder()
.include(CRHMBenchmark.class.getSimpleName())
.warmupIterations(10)
.warmupTime(TimeValue.seconds(1))
.measurementIterations(10)
.measurementTime(TimeValue.seconds(1))
.addProfiler(AsyncProfiler.class)
.forks(1)
.shouldFailOnError(true)
.build();
new Runner(opt).run();
}
}
Please note that in this case, we no longer need to specify additional VM settings; they are added automatically in the method AsyncProfiler.addJVMOptions(). Let's look at the output:
ns percent samples top
---------- ------- ------- ---
4270110916 27.81% 427 o.s.u.ConcurrentReferenceHashMap$Segment.<init>
3920827445 25.53% 392 o.s.u.ConcurrentReferenceHashMap$ReferenceManager.<init>
3691037002 24.04% 369 o.s.u.ConcurrentReferenceHashMap.createReferenceManager
1719959854 11.20% 172 o.s.u.ConcurrentReferenceHashMap.<init>
439959922 2.87% 44 java.lang.ref.ReferenceQueue.<init>
279927288 1.82% 28 java.util.concurrent.locks.ReentrantLock.<init>
70590822 0.46% 7 smp_call_function_single_[k]
As expected, [] disappeared from the profile calculateShift(), although this didn't add any clarity. A code review reveals one possible improvement: since the constructor argument Segment(int)is always the same for the entire loop in the constructor CRHM, the expression 1 << calculateShift(initialCapacity, MAXIMUM_SEGMENT_SIZE)can be evaluated only once. This won't provide a significant improvement.
So, we're at a dead end: the source code for hot methods is small, and it's impossible to find a clue to the problem just by looking. JFR and async-profiler only provide a rough direction for searching, but pinpointing the exact line will require a more precise, low-level tool.
We open it
Let's connect o.o.j.p.LinuxPerfAsmProfiler, for clarity I'll do this again in code (an option with a command line argument is available -prof perfasm):public class BenchmarkRunner {
public static void main(String[] args) throws Exception {
Options opt = new OptionsBuilder()
.include(CRHMBenchmark.class.getSimpleName())
.warmupIterations(10)
.warmupTime(TimeValue.seconds(1))
.measurementIterations(1) // одного длинного прогона достаточно
.measurementTime(TimeValue.seconds(10))
.addProfiler(LinuxPerfAsmProfiler.class)
.forks(1) // важно!
.shouldFailOnError(true)
.jvmArgsAppend(
"-XX:+UnlockDiagnosticVMOptions",
"-XX:+PrintAssembly"
)
.build();
new Runner(opt).run();
}
}
Please note: using this profiler requires some preparatory work, which I described in one of the previous articles .
Also, the presence of 1 process here is decisive, because different processes will most likely have different command addresses, this is separately stated in the documentation .
We study the collected data
At first glance, it's a bit of a mess : it's unclear where or what to look for. But if you look closely, on the left, we see the percentage of time each instruction takes; to the right, its address, name, and corresponding bytecode; and further to the right, the exact method and line reference in the Java source code ! Note: a single bytecode can correspond to multiple instructions. Then it's a matter of technique: scroll through the code and look for hotspots, like this:// строка 78
4.82% 0x00007f137d227722: mov 0x8(%rsp),%r14
The reader is probably scratching their head and thinking, "Hmm, what am I supposed to see here?" I admit, I stared at this for a long time without a single coherent thought until @apangin pointed out that perf often shifts hot spots in the output. This unpleasant phenomenon is called performance event skid and is defined as follows:
You can read more about this in Denis Bakhvalov's article .The skid is defined as the distance between the IP(s) that caused the issue to the IP(s) where the event is tagged
For us, this means we need to look somewhere around the hot lines:
0.44% 0x00007f137d22771b: mov %r10,%r13 ;*getfield segments
; - o.s.u.CRHM::<init>@121 (line 183)
0x00007f137d22771e: mov (%rsp),%r9d
4.82% 0x00007f137d227722: mov 0x8(%rsp),%r14
0.11% 0x00007f137d227727: mov 0x10(%rsp),%rsi
0x00007f137d22772c: mov 0x18(%rsp),%r11
0x00007f137d227731: mov 0x20(%rsp),%r8
0.66% 0x00007f137d227736: mov 0x30(%rsp),%rdi ;*aload_0
; - o.s.u.CRHM::<init>@128 (line 184)
The bytecode getfieldmeans reading a field, in this case segments, on line 183:
for (int i = 0; i < this.segments.length; i++) {
this.segments = new Segment(roundedUpSegmentCapacity);
}
Why so many, and why didn't the execution optimize access in such simple code? To answer this question, we need to look at other hot instructions:
// строка 124
18.29% 0x00007f137d2277e4: mov 0x60(%r15),%rdx
It's no clearer here than in the first example, let's look around:
0.99% 0x00007f137d2277d7: mov %r12l,(%r10,%rcx)
0x00007f137d2277db: mov %r12d,0x14(%rbx)
0x00007f137d2277df: lock addl $0x0,(%rsp) ;*putfield count
; - o.s.u.CRHM$Segment::<init>@11 (line 476)
; - o.s.u.CRHM::<init>@141 (line 184)
18.29% 0x00007f137d2277e4: mov 0x60(%r15),%rdx
0x00007f137d2277e8: mov %rdx,%r10
0x00007f137d2277eb: add $0x18,%r10
0.55% 0x00007f137d2277ef: cmp 0x70(%r15),%r10
Interestingly, a whole 18.29% is taken up by the entry in the field countin line 476:
protected final class Segment extends ReentrantLock {
private volatile int count = 0;
}
Looks like it's a bull's eye! We're writing 0 to an integer field, which by specification is simply 0 (and all this in a loop). And that 18.29% is being inflated by that nasty guy volatile:
@OutputTimeUnit(TimeUnit.NANOSECONDS)
@BenchmarkMode(value = Mode.AverageTime)
public class VolatileFieldZeroingBenchmark {
@Benchmark
public Object explicitInit() {
return new Class1();
}
@Benchmark
public Object defaultInit() {
return new Class2();
}
private static class Class1 {
private volatile boolean field = false;
}
private static class Class2 {
private volatile boolean field;
}
}
In both cases, after creating the object, the value of the fields will be false, but with explicit assignment the cost is significantly higher:
Benchmark Score Error Units
VolatileFieldZeroingBenchmark.explicitInit 11.200 ± 0.270 ns/op
VolatileFieldZeroingBenchmark.defultInit 3.447 ± 0.208 ns/op
Writing to a volatile field forces the compiler to insert instructions to ensure sequential consistency according to the memory model. In our case, this is the instruction lock addl $0x0,(%rsp), which is the barrier implementation StoreLoad. Memorizing these low-level implementation details is not necessary (they may change over time); understanding the high-level patterns is important.
It turns out that nothing prevents us from replacing the expression
private volatile int count = 0;
expression
private volatile int count;
Or does it actually interfere? Alexey Shipilev posed this question in a well-known multithreading mailing list . I strongly recommend a thoughtful reading as an example of how to make assumptions about how multithreaded code and the memory model will behave.
Doug Lee put the finishing touches :
The story itself dates back to 2008 (!): Remove unnecessary explicit initialization of volatile variables . Related to this task areBut your account is a more careful version of reasoning we've done before to conclude that there is never any reason to explicitly initialize fields to 0/0.0/false/null.
- AbstractMap unnecessarily initializes two volatiles to null
- Remove unnecessary explicit initialization of volatile variables in java.base
- Initializing volatile fields to default values should be optimized
- Remove unnecessary explicit initialization of volatile variables in security-libs code
@OutputTimeUnit(TimeUnit.NANOSECONDS)
@BenchmarkMode(value = Mode.AverageTime)
public class AtomicZeroingBenchmark {
@Benchmark
public Object defaultValue() {
return new AtomicInteger();
}
@Benchmark
public Object explicitValue() {
return new AtomicInteger(0);
}
}
The first method is expected to work faster:
Benchmark Mode Cnt Score Error Units
AtomicZeroingBenchmark.defaultValue avgt 20 3,037 ± 0,100 ns/op
AtomicZeroingBenchmark.explicitValue avgt 20 13,976 ± 0,220 ns/op
Here are some examples from life: one , two , three .
Now let's return to the assembler. We find similar code below:
// строка 192
0x00007f137d2278c9: lock addl $0x0,(%rsp) ;*putfield head
; - java.lang.ref.ReferenceQueue::<init>@18 (line 56)
; - o.s.u.CRHM$ReferenceManager::<init>@14 (line 984)
; - o.s.u.CRHM::createReferenceManager@5 (line 207)
; - o.s.u.CRHM$Segment::<init>@16 (line 485)
; - o.s.u.CRHM::<init>@141 (line 184)
17.31% 0x00007f137d2278ce: mov %r10d,0xc(%rdx) ;*putfield queue
; - o.s.u.CRHM$ReferenceManager::<init>@17 (line 984)
; - o.s.u.CRHM::createReferenceManager@5 (line 207)
; - o.s.u.CRHM$Segment::<init>@16 (line 485)
; - o.s.u.CRHM::<init>@141 (line 184)
0x00007f137d2278d2: mov %r12,0x10(%rbp) ;*putfield queueLength
The symptoms are the same, and the culprit is java.lang.ref.ReferenceQueue:
public class ReferenceQueue<T> {
private volatile Reference<? extends T> head = null;
}
Since it's a JDK class, there's nothing we can do with it (this is fixed in Java 9+ ).
Let's move on. At the very end of the assembly code, we find the following section:
8.00% 0x00007f137d22766a: mov %rbp,%r8
0.22% 0x00007f137d22766d: mov %r10d,0x20(%rbp)
0x00007f137d227671: mov %rbp,%r10
0.66% 0x00007f137d227674: shr $0x9,%r10
0x00007f137d227678: movabs $0x7f138fec8000,%r11
0x00007f137d227682: mov %r12l,(%r11,%r10)
0x00007f137d227686: lock addl $0x0,(%rsp) ;*putfield references
; - o.s.u.CRHM$Segment::<init>@43 (line 487)
; - o.s.u.CRHM::<init>@141 (line 184)
10.51% 0x00007f137d22768b: mov 0x20(%rbp),%r11d ;*getfield references
; - o.s.u.CRHM$Segment::<init>@48 (line 488)
; - o.s.u.CRHM::<init>@141 (line 184)
0.11% 0x00007f137d22768f: mov 0xc(%r11),%r10d ;*arraylength
; - o.s.u.CRHM$Segment::<init>@51 (line 488)
; - o.s.u.CRHM::<init>@141 (line 184)
; implicit exception: dispatches to 0x00007f137d227e91
Here 8% is occupied by the same one lock addl $0x0,(%rsp), corresponding to the entry in the volatile field in the constructor Segment:
protected final class Segment extends ReentrantLock {
private volatile Reference<K, V>[] references;
public Segment(int initialCapacity) {
this.references = createReferenceArray(this.initialSize);
}
}
volatileIt's needed here for proper operation in a multithreaded environment, so we'll skip it, but the 10.51% corresponding to the bytecode arraylengthon line 488 is worth a closer look:
protected final class Segment extends ReentrantLock {
private volatile Reference<K, V>[] references;
public Segment(int initialCapacity) {
this.references = createReferenceArray(this.initialSize);
this.resizeThreshold = (int) (this.references.length * getLoadFactor());
}
}
Since we're reading from a volatile field, reading is more expensive than usual. A solution here might be to create a local variable that stores the array returned from createReferenceArray, and then assign and read from it.
Comment
The presence of volatile accesses within the loop, as well as array access via a field reference, made access quite expensive. This access is precisely what triggers the very first hot section of the assembler:
for (int i = 0; i < this.segments.length; i++) { // читаем из поля
this.segments = new Segment(roundedUpSegmentCapacity); // пишем в поле
}
What to do with this is described in detail in the article mentioned at the very beginning , so I will not dwell on this in detail.
What about newer versions?
Nothing prevents us from running the same benchmark on newer versions of Java, such as 11/17. And then we'll get a surprise: everything will work as before, but the results will be slightly different.The full conclusion is here , and after skimming through it we suddenly discover that all mention has disappeared from it putfield count.
When I first realized this, I thought the optimizing compiler in later versions had become so sophisticated that it could recognize and discard the unnecessary assignment of a default value to a volatile field. But I still decided to double-check and search lock addl $0x0. And this instruction was still there:
╭ 0x00007f5408368ff5: jmp 0x7f5408369004
│ 0x00007f5408368ff7: mov %rdi,0xfffffffffffffff8(%r10,%r9)
│ ;*putfield sync {reexecute=0 rethrow=0 return_oop=0}
│ ; - j.u.c.l.ReentrantLock::<init>@12 (line 239)
│ ; - o.s.u.CRHM$Segment::<init>@6 (line 484)
│ ; - o.s.u.CRHM::<init>@141 (line 184)
│ 0x00007f5408368ffc: add $0xfffffffffffffff8,%r9
│ 0x00007f5408369000: mov %r9,0x70(%r15)
0.87% ↘ 0x00007f5408369004: movl $0x0,0x14(%rbx)
0.05% 0x00007f540836900b: lock addl $0x0,0xffffffffffffffc0(%rsp)
24.08% 0x00007f5408369011: mov 0x118(%r15),%r13
0x00007f5408369018: mov %r13,%r10
As before, it is executed after calling the constructor ReentrantLockof which is a child class ConcurrentReferenceHashMap$Segment. The main difficulty is that if a developer starts profiling on Java 11 or higher, they simply won't see a reference to a specific line in the Java source code!
I didn't have a complete understanding of what was going on, so I asked a question .
It turned out that optimizations and permutations in JIT execution broke the correlation between the compiled code and the source code. However, there is a solution: by running the code with a flag -XX:MaxInlineLevel=0(disables pasting), we get what we need:
0.99% 0x00007fc53836b418: movl $0x0,0x14(%rbp)
0x00007fc53836b41f: lock addl $0x0,0xffffffffffffffc0(%rsp)
;*putfield count {reexecute=0 rethrow=0 return_oop=0}
; - o.s.u.CRHM$Segment::<init>@11 (line 476)
; - o.s.u.CRHM::<init>@141 (line 184)
18.78% 0x00007fc53836b425: mov (%rsp),%rsi
0.10% 0x00007fc53836b429: nop
This is obviously a poor solution, since the embedding depth in production code will differ from that used in experiments. It seems I should write to the hotspot-compiler-dev mailing list . The response was not long in coming:
Short translation: no one promised you anything, but hang in there! All the best and happy profilingThere's never been any guarantee that debuginfo will be complete after transformations. Optimization rewrites things to such an extent that it's not really possible anyway: operations are reorganized and combined in such a way that the relationship between incoming bytecode and generated code is not 1:1.
.Comment
I strongly advise against using the described workaround for this limitation ( -XX:MaxInlineLevel=0) as the sole diagnostic tool, as disabling pasting can significantly distort the profile. This can be demonstrated with a simple example:
@BenchmarkMode(Mode.AverageTime)
@OutputTimeUnit(TimeUnit.NANOSECONDS)
public class TurnOffInliningBenchmark {
@Benchmark
public int calculate() {
return calculate(200);
}
@Benchmark
@Fork(jvmArgsAppend = {"-XX:MaxInlineLevel=0"})
public int calculateNoInlining() {
return calculate(200);
}
private Integer calculate(int length) {
Integer sum = 0;
for (int i = 0; i < length; i++) {
sum += i;
}
return sum;
}
}
If you run this benchmark on older versions (for example, 17), the method calculateNoInlining()will lose by a huge margin in both time and memory consumption:
Benchmark Score Error Units
TurnOffInliningBenchmark.calculate 51,099 ± 0,842 ns/op
TurnOffInliningBenchmark.calculate:·gc.alloc.rate 0,001 ± 0,001 MB/sec
TurnOffInliningBenchmark.calculate:·gc.alloc.rate.norm ≈ 10⁻⁴ B/op
TurnOffInliningBenchmark.calculate:·gc.count ≈ 0 counts
TurnOffInliningBenchmark.calculateNoInlining 766,289 ± 17,697 ns/op
TurnOffInliningBenchmark.calculateNoInlining:·gc.alloc.rate 2443,419 ± 54,399 MB/sec
TurnOffInliningBenchmark.calculateNoInlining:·gc.alloc.rate.norm 2944,301 ± 0,014 B/op
TurnOffInliningBenchmark.calculateNoInlining:·gc.churn.G1_Eden_Space 2437,723 ± 70,539 MB/sec
TurnOffInliningBenchmark.calculateNoInlining:·gc.churn.G1_Eden_Space.norm 2937,362 ± 52,498 B/op
TurnOffInliningBenchmark.calculateNoInlining:·gc.churn.G1_Survivor_Space 0,015 ± 0,002 MB/sec
TurnOffInliningBenchmark.calculateNoInlining:·gc.churn.G1_Survivor_Space.norm 0,018 ± 0,003 B/op
TurnOffInliningBenchmark.calculateNoInlining:·gc.count 596,000 counts
TurnOffInliningBenchmark.calculateNoInlining:·gc.time 469,000 ms
The profile will, of course, be greatly distorted.
But that's not all!
Luckily for me, I didn't limit myself to one or two runs, and when I ran the benchmark again with Java 11, I suddenly found the desired output putfield count!0.97% ↘ 0x00007f6ff436a099: mov 0x10(%rsp),%r10
0.05% 0x00007f6ff436a09e: movl $0x0,0x14(%r10)
0x00007f6ff436a0a6: lock addl $0x0,0xffffffffffffffc0(%rsp)
;*putfield count {reexecute=0 rethrow=0 return_oop=0}
; - o.s.u.CRHM$Segment::<init>@11 (line 476)
25.36% 0x00007f6ff436a0ac: mov 0x8(%rsp),%r10
At this point, I was completely at a loss. After a few more runs, the picture became a bit clearer: the indication of a putfield countfailure appeared randomly in the output when running in normal mode (in other words, without any additional VM configuration). Then I decided to collect some statistics:
#!/bin/bash
for i in {1..100}
do
touch "$i".txt
/usr/lib/jvm/java-11-openjdk-amd64/bin/java \
-jar ../target/benchmarks.jar CRHMBenchmark \
-f 1 -wi 5 -i 1 -w 1s -r 1s -prof perfasm \
-jvmArgsAppend "-XX:+UnlockDiagnosticVMOptions -XX:+PrintAssembly" > "$i".txt
done
In this script, we perform 100 runs and write the output of each to a separate file. Then, we go to the file folder and count the number of occurrences of the search string:
#!/bin/bash
declare -i count=0;
declare -i count_in_file=0;
for i in *.txt;
do
count_in_file=$((`grep -o -i 'putfield count' $i | wc -l`));
count=$((count + count_in_file));
done
echo $count
This is what I got:
0.90% 0x00007f2513331eae: lock addl $0x0,-0x40(%rsp) ;*putfield count {reexecute=0 rethrow=0 return_oop=0}
0.03% 0x00007fc1bbb924ab: lock addl $0x0,-0x40(%rsp) ;*putfield count {reexecute=0 rethrow=0 return_oop=0}
0.07% 0x00007f9972d021ae: lock addl $0x0,-0x40(%rsp) ;*putfield count {reexecute=0 rethrow=0
...
0.42% 0x00007f99b03999ae: lock addl $0x0,-0x40(%rsp) ;*putfield count {reexecute=0 rethrow=0 return_oop=0}
24
Simply put, in 24 cases out of 100, the compiler preserved the reference to putfield count. Not very encouraging, right? So, you can never rely on a single run! After all, some data might get lost, and you simply won't see the reference to the hot spot in the Java source code. Therefore, I recommend running 10-20 runs with output to a file and reviewing each one separately.
Bottom line
So, what did we achieve with our changes ( one , two ):J8 SB 2.1.1 J8 SB 2.3.11 J11 SB 2.3.11
count Units
dto 1 14.0 ± 0.1 5.8 ± 0.3 6.2 ± 0.1 us/op
proj 1 17.2 ± 0.2 10.3 ± 0.2 10.1 ± 0.0 us/op
dto 100 45.6 ± 0.7 35.0 ± 0.2 31.0 ± 0.5 us/op
proj 100 216.9 ± 0.4 199.6 ± 0.5 180.8 ± 0.8 us/op
Here J8 and J11 are Java 8/11, and SB is Spring Boot of the corresponding version.
General conclusions for the developer
- In complex cases where it's unclear where exactly to look, don't be afraid to dive deeper and look at the assembler.
- Remember that all profilers are subject to error; see the excellent reports by Nitsan Wakart - Profilers are lying hobbits and Andrey Pangin - The Art of Java Profiling
- Don't be shy about asking questions - by explaining it to others you will better understand the task at hand
Practical conclusions for the developer
- Remove default assignments to volatile fields in your applications. It will provide some performance gains and won't break anything (and if it does, be sure to report it at http://cs.oswego.edu/pipermail/concurrency-interest ; it will be a sensation). Also, give these issues a thumbs up:
https://youtrack.jetbrains.com/issue/IDEA-243752
https://youtrack.jetbrains.com/issue/IDEA-251885
That way, they'll get attention faster - Use virtual machine flags when running your tests; they'll help you narrow your search. For example, if you suspect the compiler is the culprit, try running with -Xint/ -XX:TieredStopAtLevel=1or the aforementioned -XX:MaxInlineLevel=0, but remember that these can be both helpful and confusing. Experiment with different combinations to get reliable results.
- perform multiple runs and collect statistics
The main takeaway for the developer (straight from JMH)
That's all for now. I hope you found this post interesting and useful. Until next timeREMEMBER: The numbers below are just data. To gain reusable insights, you need to follow up on why the numbers are the way they are. Use profilers (see -prof, -lprof), design factorial experiments, perform baseline and negative tests that provide experimental control, make sure the benchmarking environment is safe on JVM/OS/HW level, ask for reviews from the domain experts. Do not assume the numbers tell you what you want them to tell.