


Today, web application security is crucial, so even developers need to master pentesting tools. We've already written about the powerful WPScan framework for WordPress pentesting, but websites also run on other platforms. That's why today we'll explore the more versatile OWASP ZAP (Zed Attack Proxy) pentesting tool.
OWASP (Open Web Application Security Project) is a global non-profit organization dedicated to improving software security.
OWASP ZAP (Zed Attack Proxy) is one of the most popular security tools in the world. It's part of the OWASP community, meaning it's completely free.
It is designed for users with a wide range of security experience, making it ideal for developers and functional testers who are new to penetration testing.
ZAP creates a proxy server between the client and your website. While you navigate your website, it records all your actions and then attacks the site using known methods.
The project was launched in 2010, but is still being developed and updated regularly.
ZAP is cross-platform and only requires Java 8+. Therefore, Kali Linux or other white-hat hacking OSes are not required.
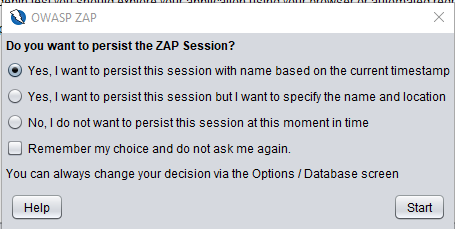
When launched, ZAP will prompt you to save the session. If you want to retrieve your website configuration or test results later, you should save the session. For now, you can select " No, I do not want to persist the session... "
From a penetration testing perspective, passive scanning is a harmless test that only looks for responses and checks them for known vulnerabilities. Passive scanning does not modify website data, making it more secure.
Active scanning attacks a website using a variety of known methods. Active scanning can modify data and inject malicious scripts. Therefore, it's best to use this method for testing websites running on a local host, as we've already done with our WordPress pentest lab .
Let's take a quick look at the ZAP user interface layout to understand the basics. The following screen lists the windows, divided into four sections.
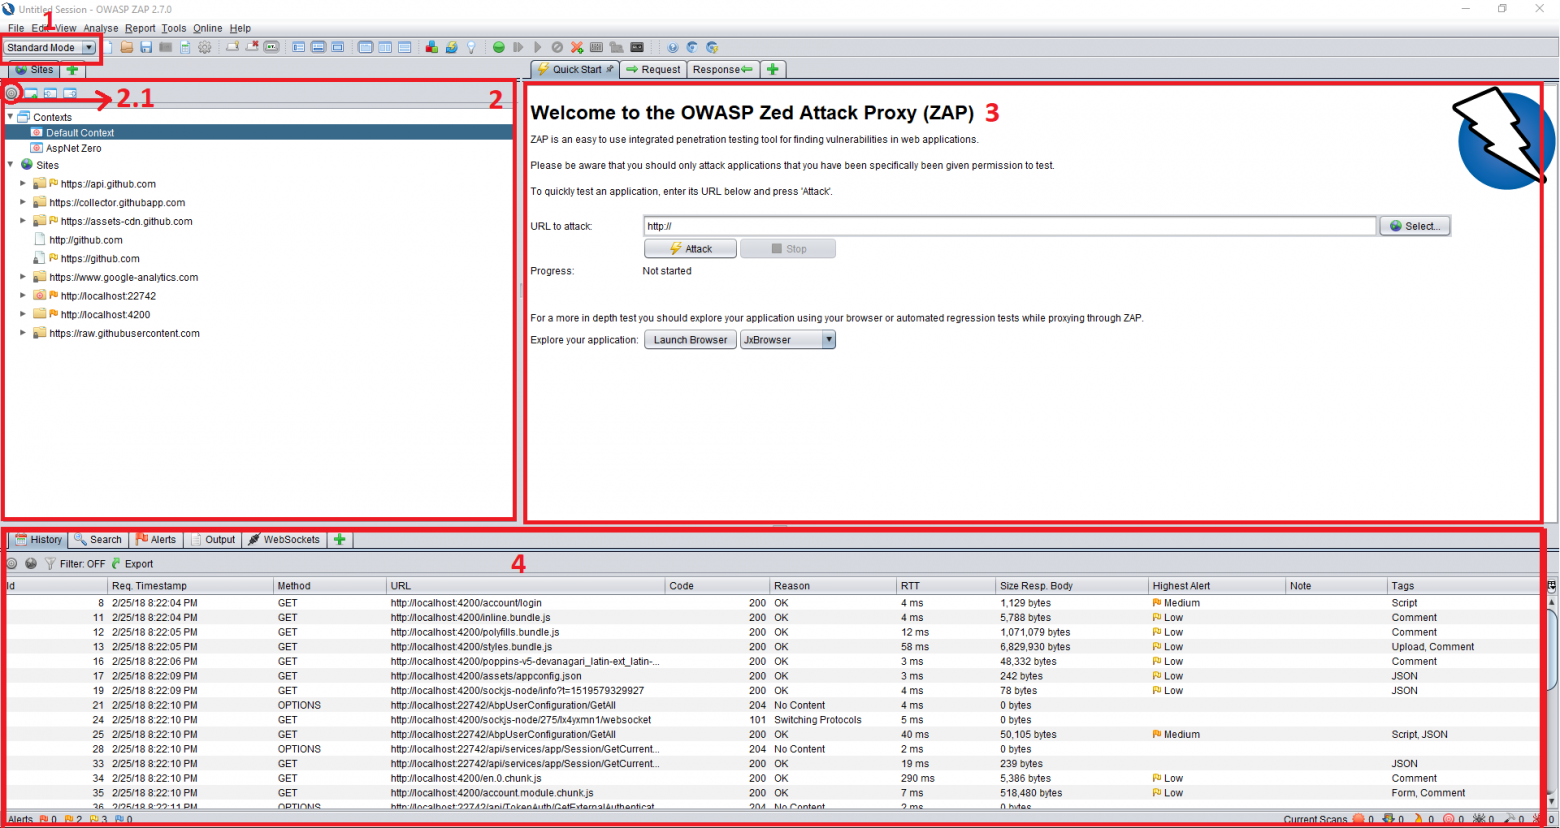
In the upper left corner of the screen you can see the modes, of which there are 4 in total:
All the websites we access through ZAP will be listed here.
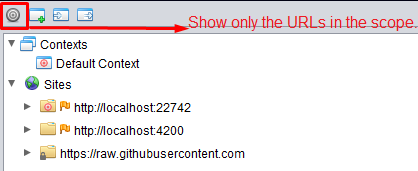
2.1 — Show URLs only . It's recommended to enable this option, as this section will be heavily cluttered after the initial tests. To focus on the target website, enable the " In Scope " flag for it.
The workspace window consists of 3 tabs:
3.1 — Quick Launch Window . This is the fastest and most direct way to initiate an active scan. Enter the target website address and click the Attack button. It will first crawl the website and then perform an active scan.
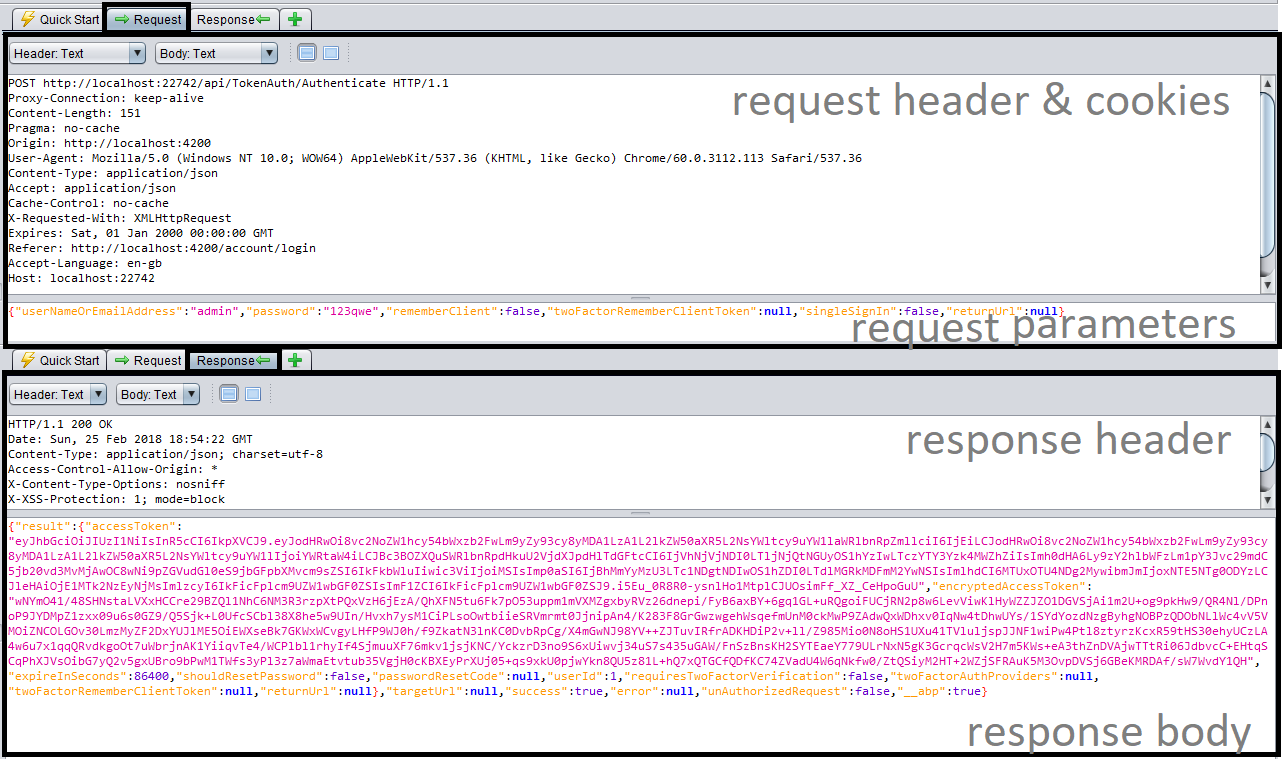
3.2 — Request and Response Window . These are the most frequently used parts of the user interface. In the Request tab, you'll see that the window is divided into two parts:
The response window is similar to the request window and shows:
The bottom window shows:
The most important tab here is the Alerts tab.
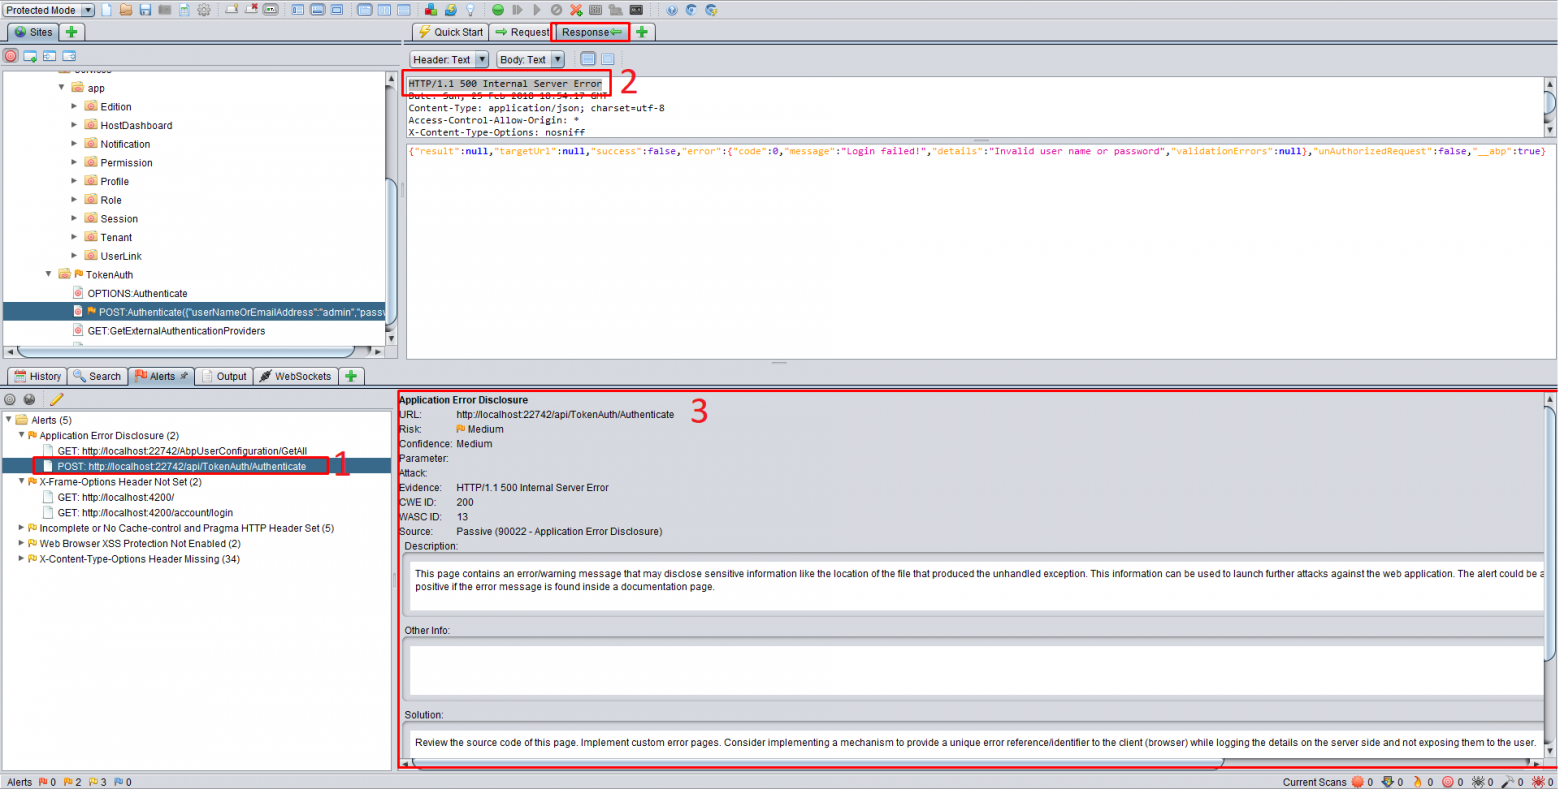
4.1 — The "Alerts" tab displays vulnerabilities detected on the target website. Clicking on an alert in the list opens the corresponding request/response in the upper right corner and displays detailed information about the vulnerability.
Let's look at what happened in the previous image.
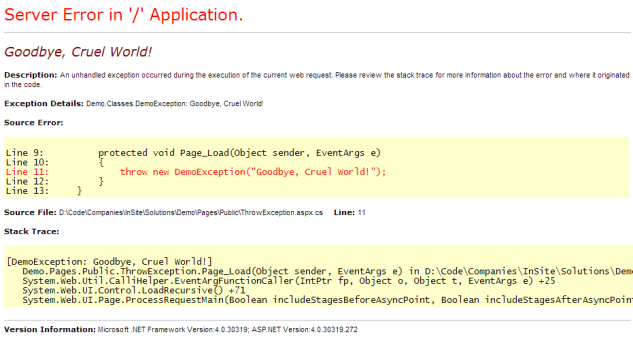
A POST request is made to http://localhost:22742/api/TokenAuth/Authenticate . The user logs in with their credentials, and the server returns an HTTP-500 error.
HTTP-500 Internal Server Error.
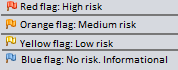
OWASP ZAP considers this a problem. In the third window, you'll see some information about it. It shows the exact URL and a yellow flag (medium risk). The description reads:
This page contains an error/warning message that may reveal sensitive information, such as the location of the file that caused the unhandled exception. This information could be used for further attacks on the web application. The warning may be false if the error message is on a documentation page.
This is great because OWASP ZAP senses some information leakage. It suspects the website is throwing an unhandled exception .
This can be a real vulnerability when a website displays an exception stack to an attacker and provides information about the environment or code. However, in our example, the response is JSON content stating "Invalid user name or password," but the developer chooses to send it via HTTP-500. This is a false positive, as no information is revealed.
The solutions section contains information on how to resolve the issue.
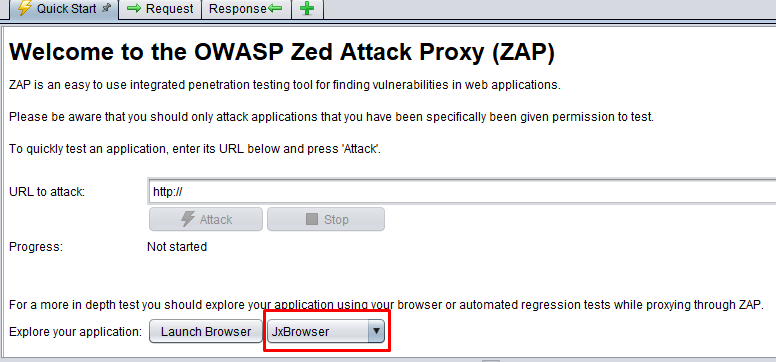
In the earlier version of OWASP ZAP, you had to configure your browser's proxy server to intercept requests, but now there's a useful feature: JxBrowser! This is a Chromium-based browser integrated into OWASP ZAP. By default, it has all the proxy configuration configured, allowing OWASP ZAP to route all traffic through it. Click " Launch Browser " and navigate to your website.
To extract a website tree, you need to scan it in JxBrowser. You need to activate all the functions and complete all the possible actions. This step is crucial!
Crawling a website means scanning all the links and obtaining the website's structure. We've written about other crawlers before.
Crawling is only necessary when navigation alone fails to access everything. It can reveal missed areas, as well as when proxying is impossible.
To launch it, right-click the site and select " Attack " from the menu, then click " Spider ." Make sure " Recurse " is checked! Click " Start Scan ." This will take some time depending on the number of links on your site.
If this is a SPA website, then you must additionally specify that the parameters represent the structure and not the application data.

If you cover all the functions and actions of your SPA site, you won't need to crawl it.
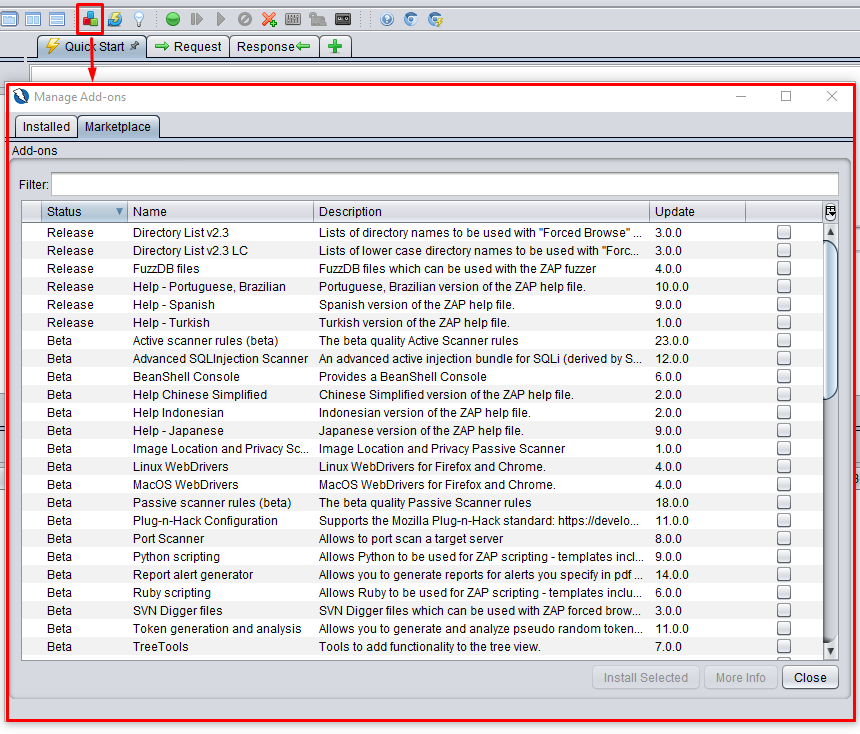
Owasp has added an extension marketplace, which you can view using the three-color rectangle icon. To install an extension, click the Marketplace tab and enter the extension name in the field. Then click the " Install Selected " button. There's no need to restart ZAP.
Some useful extensions:
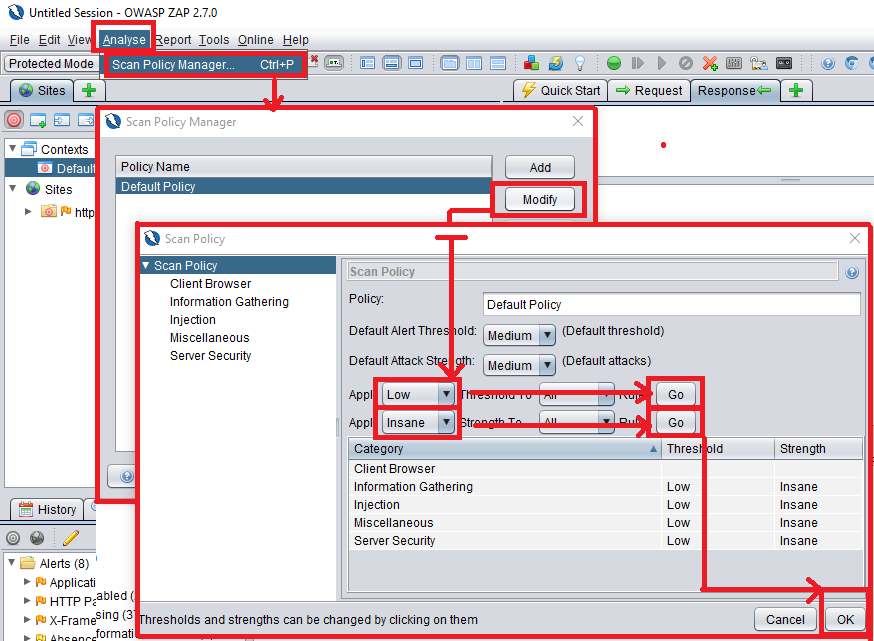
We recommend using the following scan settings. In the "Analyze" menu, select " Scan Policy Manager ." Click " Modify ." In the " Scan Policy " window, set " Low " to " Threshold To All " and click " Go ." Do the same as with "Insane" and change the scan settings to "Strength To All ." Click " Go ." All attacks will be saved in memory, making scanning more reliable. To save the settings, click "OK."
The attack on the target site is very simple.
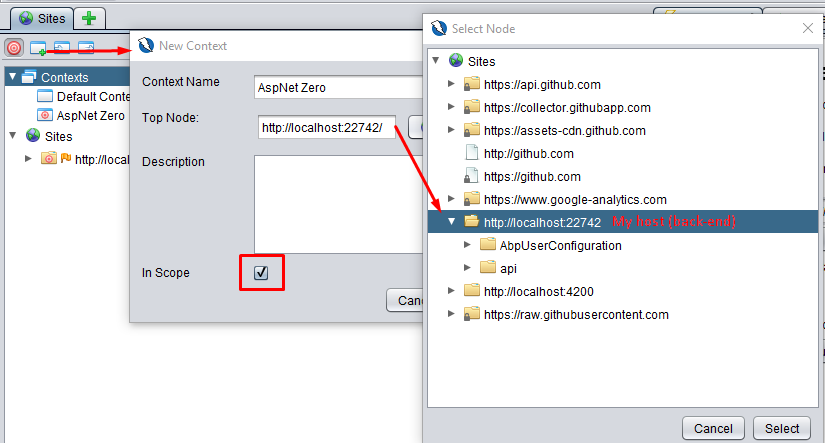
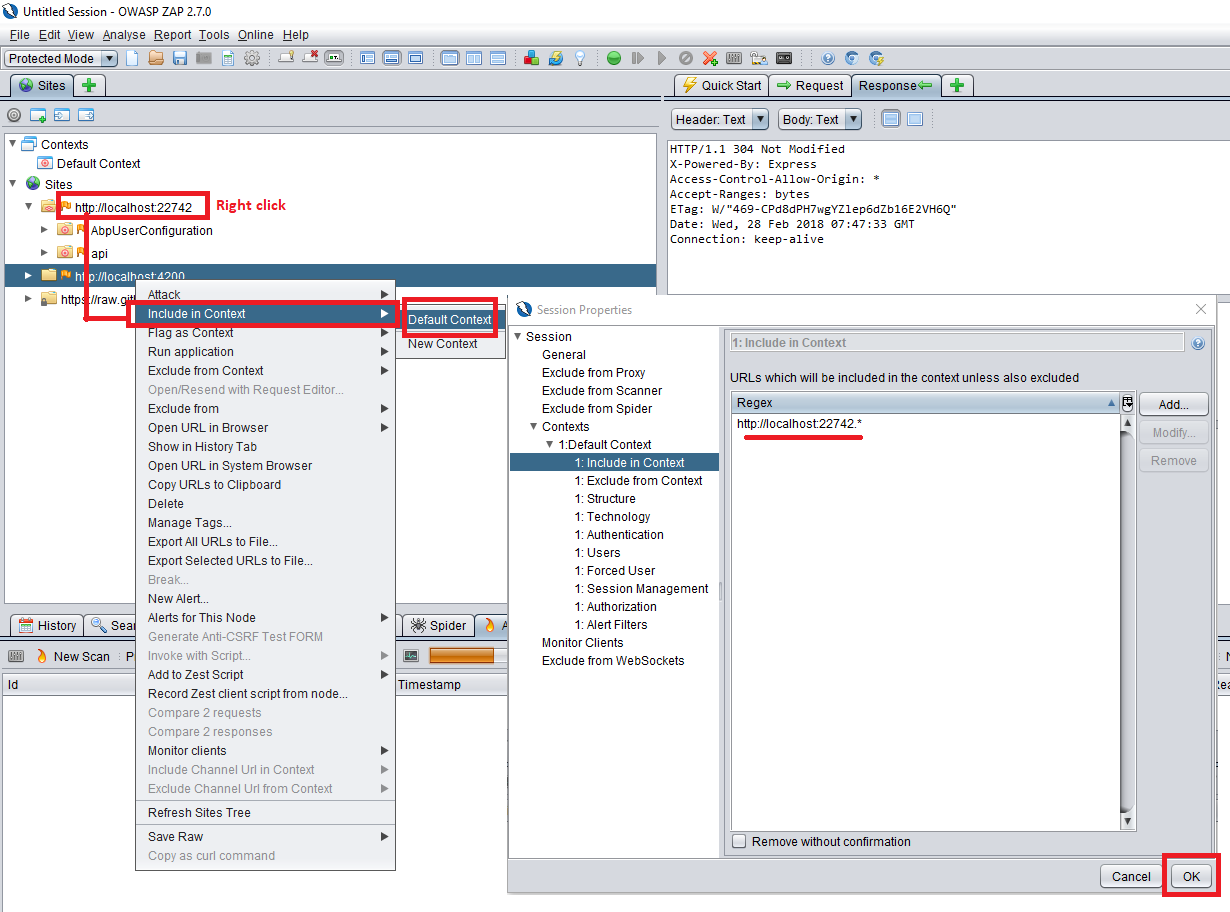
1 - Add your site to the context . To do this, right-click the target website in the left panel. Select:
Now you'll see a new website URL appear in a pop-up window, adding your website as a regular expression. The asterisk (*) in the URL indicates an attack on all URLs for that website. Finally, click OK.
2 — Show only URLs in the current scope . This hides other websites and prevents accidental attacks.
3 - Start crawling.
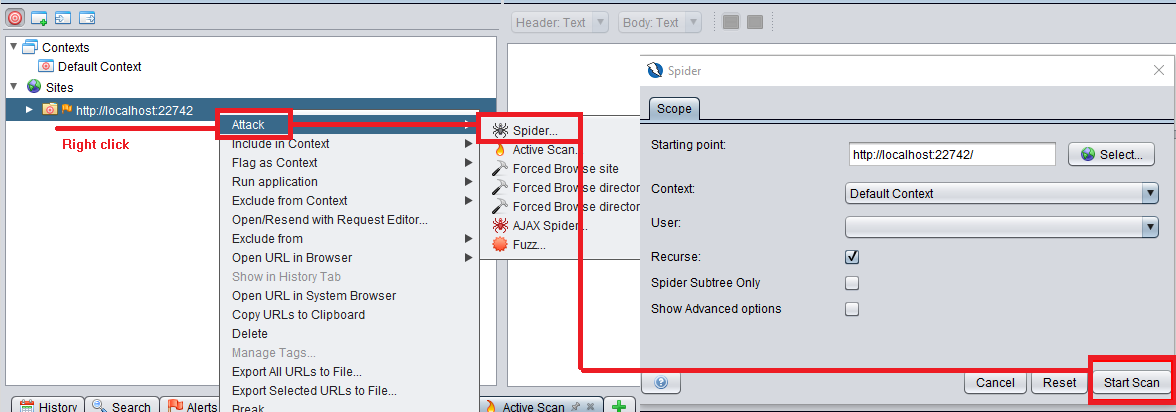
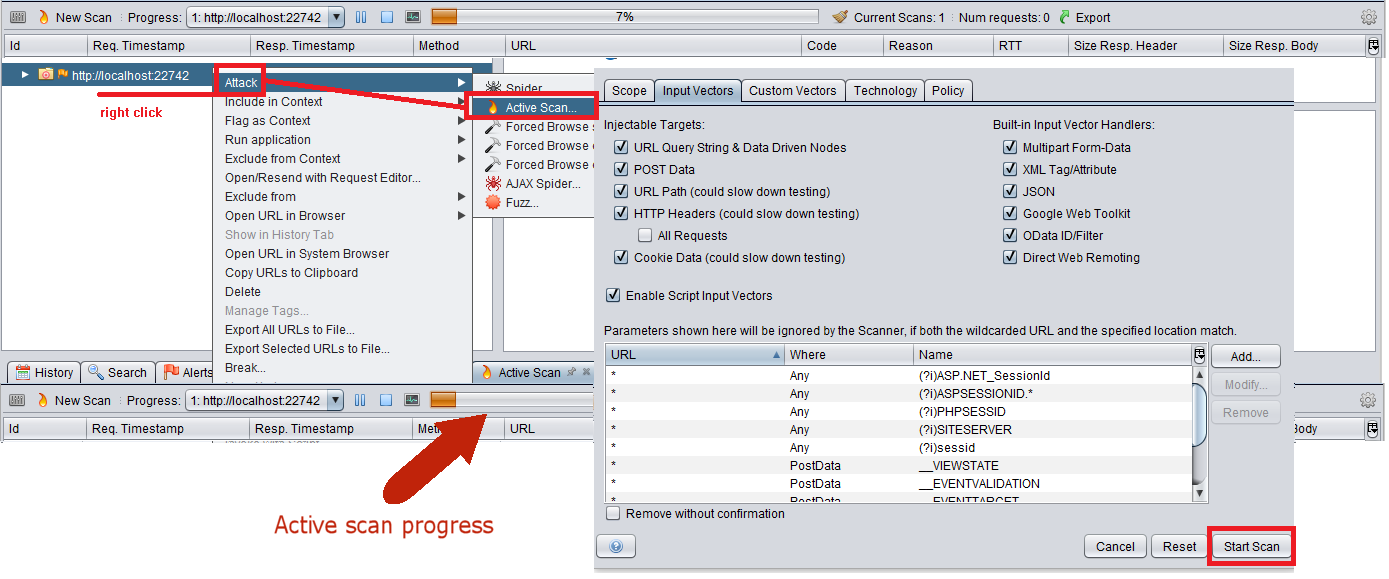
4 - Attack! This is the primary target. Let's initiate an active scan.
The "Start Scan" button will start the process, which may take a long time (depending on the number of URLs).
Fuzzing is the act of submitting unexpected or random data to website inputs. We typically validate inputs on the client side, so we ignore some server-side issues. When fuzzy key data is entered (for example, the primary search input on a website or the input on a login page), coding errors and security holes can be exposed. This is an optional security step.
If you want to run the fuzzer, find the request you want to process in the left pane. Right-click and select " Attack ," then click " Fuzz ." The fuzzer window will display the request posting data. Click on it and highlight the text you want to attack. In the right pane, click the " Add " button. You will see the Payloads window . Click " Add " again. In the " Add Payload " window, select " File Fuzzers " from the drop-down list. Select the file you want to use. This file is the database that will be used for brute-forcing. You can brute-force WordPress sites using other methods, which we have previously described.
Once the brute-force process is complete, the results will be listed in the bottom tab, labeled Fuzzer. Those marked as Fuzzed require special attention.
The crawler searches for known URLs with organic links, but it can't find a URL that isn't mentioned anywhere on the site. In this case, a forced crawl comes to the rescue, using brute-force dictionaries to check for any other hidden URLs, such as the admin panel or anything else that can be hacked.

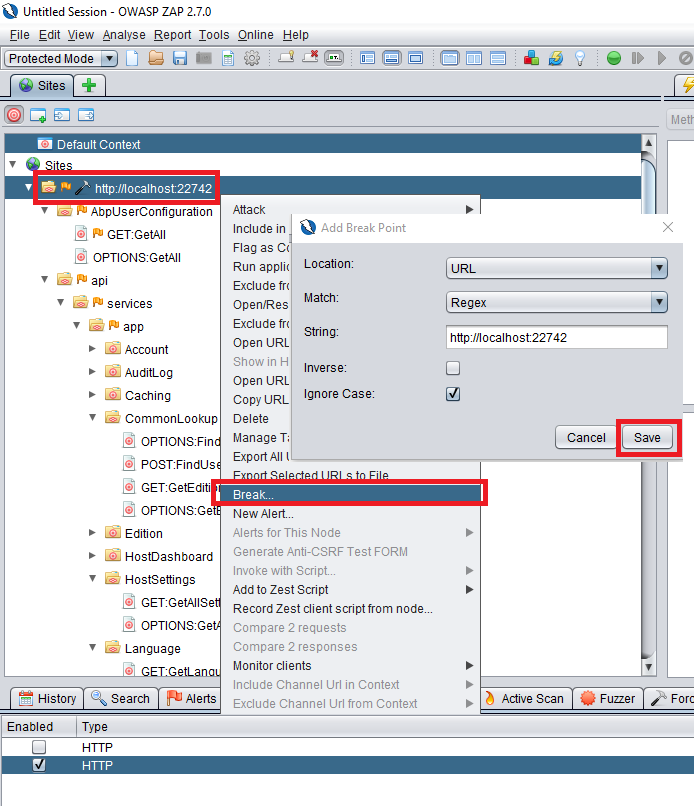
Break is a great feature for intercepting and modifying requests and responses. If you want to modify any request post data or response data, right-click the site, select " Break ," and click " Save " in the " Add Break Point " window . The bottom panel will now show that the breakpoint is enabled.
From now on, all requests will be intercepted by the OWASP ZAP tool. Whenever you make a request from the originating website, the ZAP window will appear and allow you to modify the request. After you click the green play button on the toolbar, ZAP will display the response sent by the server. This response can also be modified, so your browser will receive the modified response.
We've thoroughly scanned the site for known vulnerabilities and it's time to review the results.
You can see issues in the " Alerts " tab in the bottom panel. The next screen displays five alerts with colored flags. If there are no red flags, you're in luck. If there are red flags, you should work on fixing them first.
If you don't see any warnings, something may have been done incorrectly.
When you click on one of the alerts, the corresponding request and response window appears. There's a good reporting tool that automatically creates a convenient report file. You can export reports in the following formats:

Let's take HTML as an example.
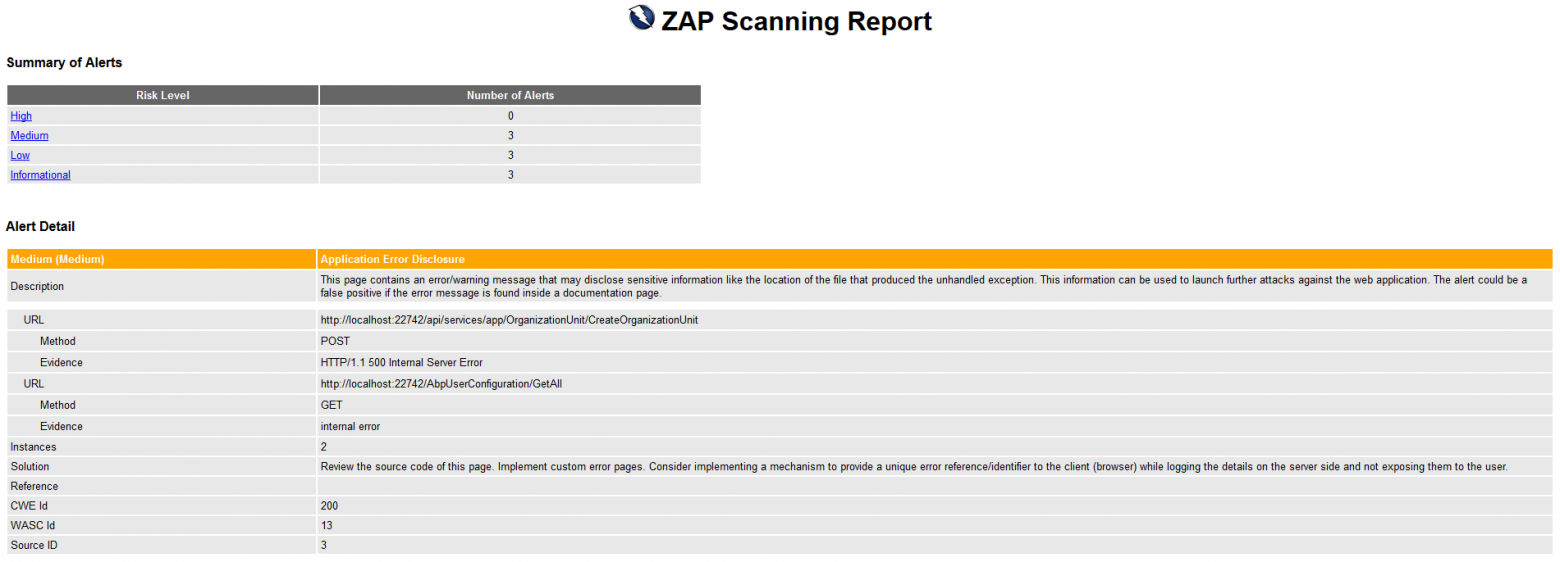
As you can see, this is a well-organized final report that can be sent in its original form to any colleague
What is OWASP ZAP?
OWASP (Open Web Application Security Project) is a global non-profit organization dedicated to improving software security.
OWASP ZAP (Zed Attack Proxy) is one of the most popular security tools in the world. It's part of the OWASP community, meaning it's completely free.
Why do many people choose OWASP ZAP?
It is designed for users with a wide range of security experience, making it ideal for developers and functional testers who are new to penetration testing.
ZAP creates a proxy server between the client and your website. While you navigate your website, it records all your actions and then attacks the site using known methods.
Open source!
The project was launched in 2010, but is still being developed and updated regularly.
Setting up the ZAP environment
ZAP is cross-platform and only requires Java 8+. Therefore, Kali Linux or other white-hat hacking OSes are not required.
Running OWASP ZAP
When launched, ZAP will prompt you to save the session. If you want to retrieve your website configuration or test results later, you should save the session. For now, you can select " No, I do not want to persist the session... "
What is the difference between active and passive scanning?
What is passive scanning?
From a penetration testing perspective, passive scanning is a harmless test that only looks for responses and checks them for known vulnerabilities. Passive scanning does not modify website data, making it more secure.
What is active scanning?
Active scanning attacks a website using a variety of known methods. Active scanning can modify data and inject malicious scripts. Therefore, it's best to use this method for testing websites running on a local host, as we've already done with our WordPress pentest lab .
Introduction to ZAP UI
Let's take a quick look at the ZAP user interface layout to understand the basics. The following screen lists the windows, divided into four sections.
1. Modes
In the upper left corner of the screen you can see the modes, of which there are 4 in total:
- Standard mode: allows you to do anything with any website.
- Attack mode: actively checks any websites.
- Safe Mode: Disables all malicious features during scanning.
- Protected Mode: Allows you to scan websites within a specific area. This prevents scanning of unwanted sites.
2. Websites
All the websites we access through ZAP will be listed here.
2.1 — Show URLs only . It's recommended to enable this option, as this section will be heavily cluttered after the initial tests. To focus on the target website, enable the " In Scope " flag for it.
3. Workspace window
The workspace window consists of 3 tabs:
3.1 — Quick Launch Window . This is the fastest and most direct way to initiate an active scan. Enter the target website address and click the Attack button. It will first crawl the website and then perform an active scan.
3.2 — Request and Response Window . These are the most frequently used parts of the user interface. In the Request tab, you'll see that the window is divided into two parts:
- The top one shows the request header and cookies.
- The bottom one shows the parameters of the message sent to the server.
The response window is similar to the request window and shows:
- Headline
- Response body
4. Lower window
The bottom window shows:
- Results
- Query history
- Test vulnerabilities
The most important tab here is the Alerts tab.
4.1 — The "Alerts" tab displays vulnerabilities detected on the target website. Clicking on an alert in the list opens the corresponding request/response in the upper right corner and displays detailed information about the vulnerability.
Let's look at what happened in the previous image.
A POST request is made to http://localhost:22742/api/TokenAuth/Authenticate . The user logs in with their credentials, and the server returns an HTTP-500 error.
HTTP-500 Internal Server Error.
OWASP ZAP considers this a problem. In the third window, you'll see some information about it. It shows the exact URL and a yellow flag (medium risk). The description reads:
This page contains an error/warning message that may reveal sensitive information, such as the location of the file that caused the unhandled exception. This information could be used for further attacks on the web application. The warning may be false if the error message is on a documentation page.
This is great because OWASP ZAP senses some information leakage. It suspects the website is throwing an unhandled exception .
This can be a real vulnerability when a website displays an exception stack to an attacker and provides information about the environment or code. However, in our example, the response is JSON content stating "Invalid user name or password," but the developer chooses to send it via HTTP-500. This is a false positive, as no information is revealed.
The solutions section contains information on how to resolve the issue.
Proxying your website: JxBrowser
In the earlier version of OWASP ZAP, you had to configure your browser's proxy server to intercept requests, but now there's a useful feature: JxBrowser! This is a Chromium-based browser integrated into OWASP ZAP. By default, it has all the proxy configuration configured, allowing OWASP ZAP to route all traffic through it. Click " Launch Browser " and navigate to your website.
Site navigation
To extract a website tree, you need to scan it in JxBrowser. You need to activate all the functions and complete all the possible actions. This step is crucial!
Website crawling
Crawling a website means scanning all the links and obtaining the website's structure. We've written about other crawlers before.
Why do we need crawling?
Crawling is only necessary when navigation alone fails to access everything. It can reveal missed areas, as well as when proxying is impossible.
To launch it, right-click the site and select " Attack " from the menu, then click " Spider ." Make sure " Recurse " is checked! Click " Start Scan ." This will take some time depending on the number of links on your site.
How to test a SPA (Single Page Application)?
If this is a SPA website, then you must additionally specify that the parameters represent the structure and not the application data.
If you cover all the functions and actions of your SPA site, you won't need to crawl it.
Extensions
Owasp has added an extension marketplace, which you can view using the three-color rectangle icon. To install an extension, click the Marketplace tab and enter the extension name in the field. Then click the " Install Selected " button. There's no need to restart ZAP.
Some useful extensions:
- Active Scanner rules
- Passive Scanner rules
- FuzzDB
Scan settings
We recommend using the following scan settings. In the "Analyze" menu, select " Scan Policy Manager ." Click " Modify ." In the " Scan Policy " window, set " Low " to " Threshold To All " and click " Go ." Do the same as with "Insane" and change the scan settings to "Strength To All ." Click " Go ." All attacks will be saved in memory, making scanning more reliable. To save the settings, click "OK."
Start of the attack
The attack on the target site is very simple.
1 - Add your site to the context . To do this, right-click the target website in the left panel. Select:
- Include in Context
- Default Context
Now you'll see a new website URL appear in a pop-up window, adding your website as a regular expression. The asterisk (*) in the URL indicates an attack on all URLs for that website. Finally, click OK.
2 — Show only URLs in the current scope . This hides other websites and prevents accidental attacks.
3 - Start crawling.
4 - Attack! This is the primary target. Let's initiate an active scan.
The "Start Scan" button will start the process, which may take a long time (depending on the number of URLs).
Fuzzing
Fuzzing is the act of submitting unexpected or random data to website inputs. We typically validate inputs on the client side, so we ignore some server-side issues. When fuzzy key data is entered (for example, the primary search input on a website or the input on a login page), coding errors and security holes can be exposed. This is an optional security step.
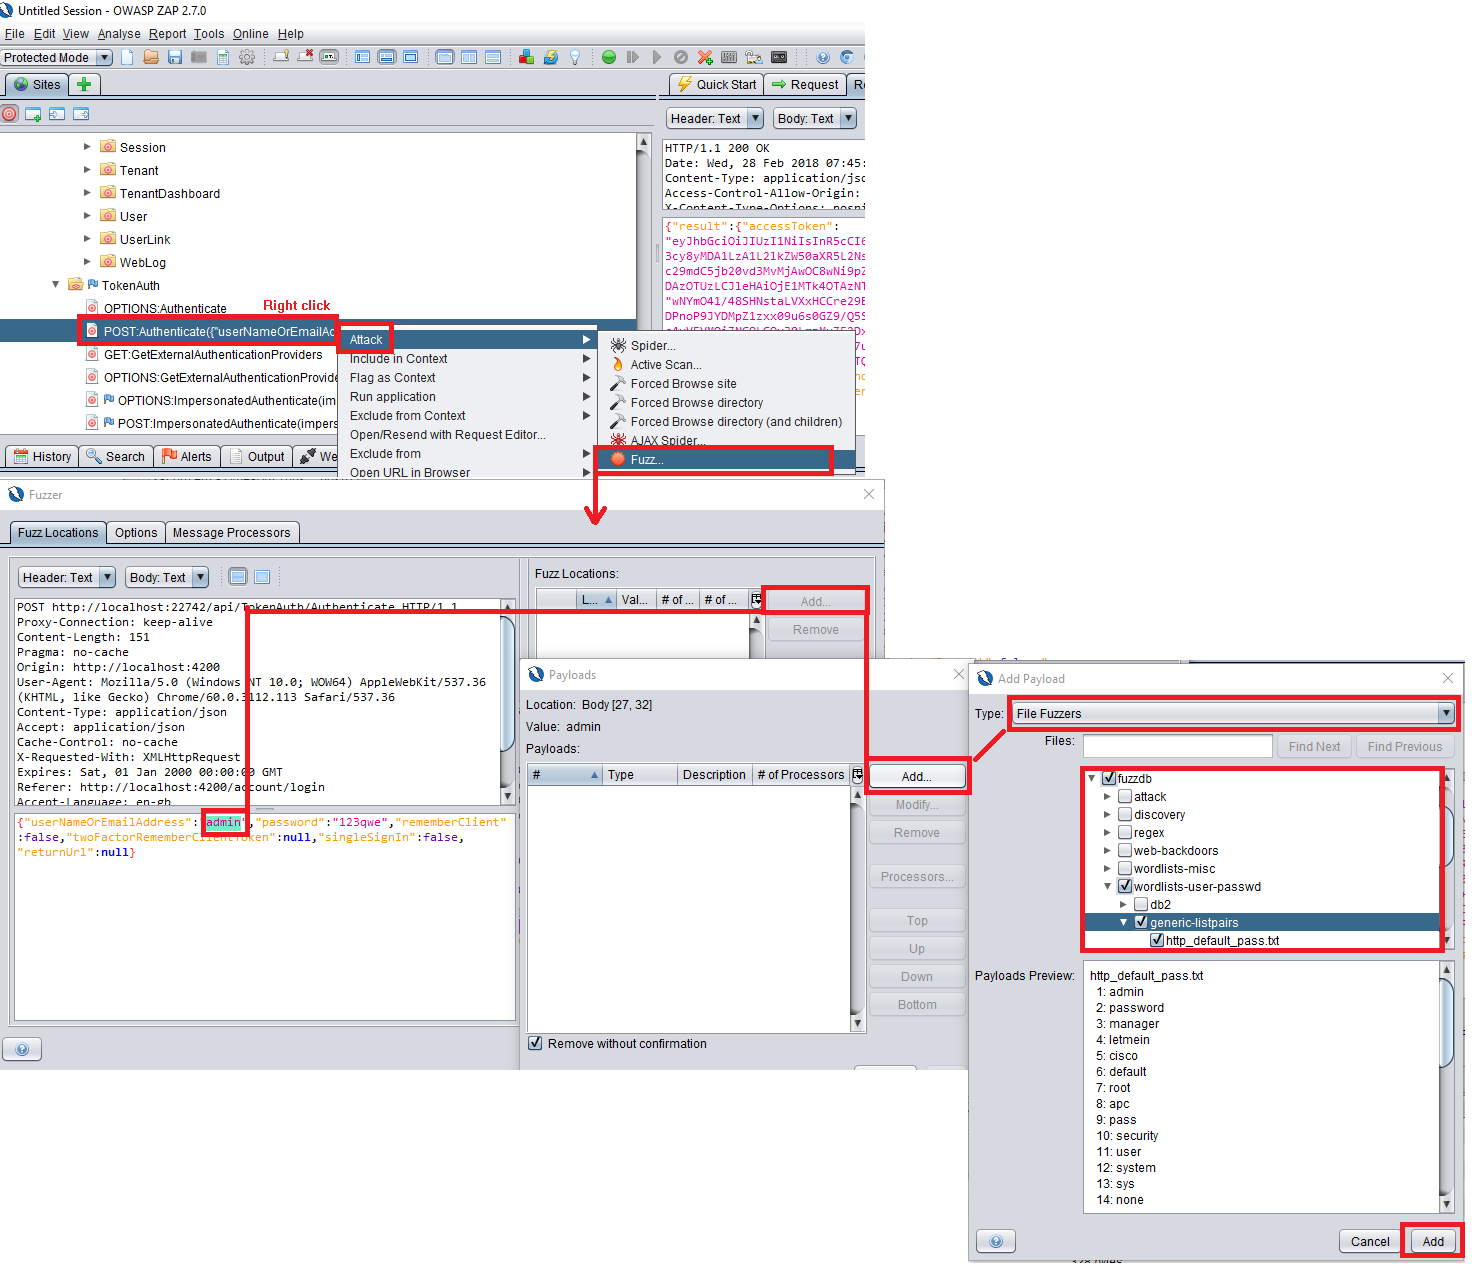
If you want to run the fuzzer, find the request you want to process in the left pane. Right-click and select " Attack ," then click " Fuzz ." The fuzzer window will display the request posting data. Click on it and highlight the text you want to attack. In the right pane, click the " Add " button. You will see the Payloads window . Click " Add " again. In the " Add Payload " window, select " File Fuzzers " from the drop-down list. Select the file you want to use. This file is the database that will be used for brute-forcing. You can brute-force WordPress sites using other methods, which we have previously described.
Once the brute-force process is complete, the results will be listed in the bottom tab, labeled Fuzzer. Those marked as Fuzzed require special attention.
Forced viewing
The crawler searches for known URLs with organic links, but it can't find a URL that isn't mentioned anywhere on the site. In this case, a forced crawl comes to the rescue, using brute-force dictionaries to check for any other hidden URLs, such as the admin panel or anything else that can be hacked.
Break
Break is a great feature for intercepting and modifying requests and responses. If you want to modify any request post data or response data, right-click the site, select " Break ," and click " Save " in the " Add Break Point " window . The bottom panel will now show that the breakpoint is enabled.
From now on, all requests will be intercepted by the OWASP ZAP tool. Whenever you make a request from the originating website, the ZAP window will appear and allow you to modify the request. After you click the green play button on the toolbar, ZAP will display the response sent by the server. This response can also be modified, so your browser will receive the modified response.
Results and report
We've thoroughly scanned the site for known vulnerabilities and it's time to review the results.
You can see issues in the " Alerts " tab in the bottom panel. The next screen displays five alerts with colored flags. If there are no red flags, you're in luck. If there are red flags, you should work on fixing them first.
If you don't see any warnings, something may have been done incorrectly.
When you click on one of the alerts, the corresponding request and response window appears. There's a good reporting tool that automatically creates a convenient report file. You can export reports in the following formats:
- HTML
- XML
- JSON
- Markdown
Let's take HTML as an example.
As you can see, this is a well-organized final report that can be sent in its original form to any colleague