


Alexander Alekseev ( Postgres Professional )
An excellent overview talk from the HighLoad++ 2016 conference on how to profile software code. It covers typical mistakes that occur during measurements. And, of course, about the tools:
- gettimeofday
- strace, ltrace, truss
- gprof
- gdb / lldb -
perf
- pmcstat
- SystemTap
- DTrace
- HeapTrack
- BPF / bcc

First, I'll start with a less technical section about how not to do benchmarks.
I see people often make typical mistakes when doing benchmarks. And here's the first one...
First, I'll start with a less technical section about how not to benchmark.In case you weren't aware, all HighLoad++ speakers undergo rigorous coaching, multiple times, on different topics. Some coaching is mandatory, others are optional. Optional coaching is like overcoming stage fright, for example. In other words, they take a very rigorous approach to organizing the whole thing. When I submitted my talk to HighLoad++, the organizers suggested removing all the technical details and adding more cool stories, beautiful screenshots, and so on. Those interested in how to run it, what commands to enter, can refer to the documentation—that's why I've linked to my blog , because it's all there.
If you're interested, for example, in the difficulty of building SystemTap on Linux, open the blog link and you'll find everything there. This talk will be more of an overview, giving you an idea of the tools available, what they offer, and when to use each one.
I see people making common mistakes when benchmarking.
- First, it's non-repeatability. When you open some blog and there's this great article about "we measured something, got these beautiful graphs, and our solution, which costs this much, does it 500 times faster." But there's no data provided to replicate this experiment, no scripts, nothing. Well, that's a crappy benchmark, and you should close the page immediately. If you can't replicate it, how can you trust it?
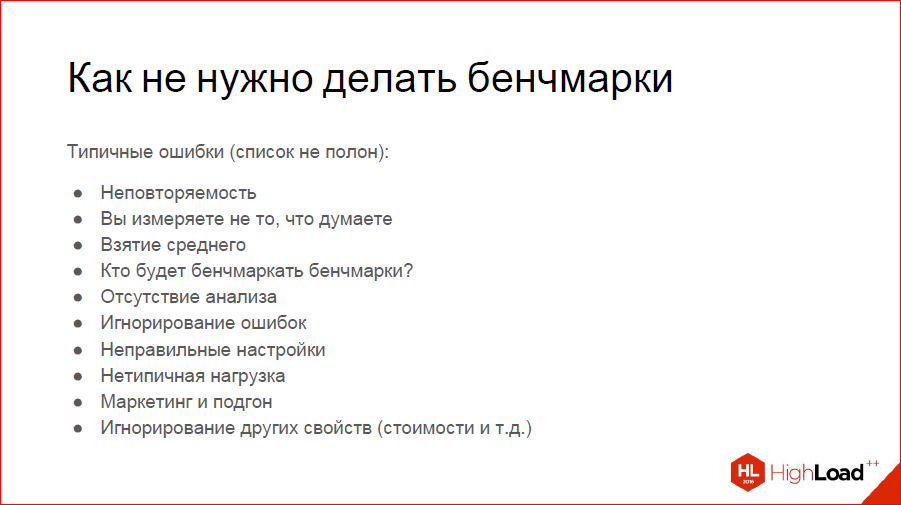
You should be able to reproduce at least approximately the same results.
- You're measuring the wrong thing. A typical example: we want to measure how our hard drive is performing. We cheerfully type dd if somewhere. We write to the disk and measure how fast it actually writes. Can anyone in the audience tell me why this isn't measuring the disk's speed?
That's right—because you're actually measuring the speed of your file system cache. How to get around this is also an interesting problem. - Taking an average. This always irritates me at our meetings, and I see a listener in the front row who understands. We need to understand how quickly we respond to user requests—let's plot a graph of average response time. The problem is that this graph might show a nice average time of 15 milliseconds, but there are peaks of 15 seconds. These can be very rare, and taking an average blurs them. You think everything is great and wonderful, but in reality, it's not. So, plot at least the average and maximum—that will give you a good picture. If that's too simple for you, plot percentiles, the 95th, 99th—that will give you an even better picture. They're not exactly cheap to plot, but they're solvable.
- Who's going to benchmark benchmarks? That's a problem. For example, you've written a cool test that measures how many responses per second your application generates. You measure it and get, say, 4,000 requests per second. You think, "That's not enough, I need to optimize it." The problem is that your benchmark is single-threaded. But under real-world load, your application runs on hundreds, even thousands of threads. And, in fact, you haven't taken into account that your own benchmark is the bottleneck in this case. You need to understand this.
- Lack of analysis. This is when you've measured something and say, "Something's slow, I need to refactor it all, rewrite everything." That is, you need to understand why it's slow.
- Ignoring errors. Again, let's go back to the example with your benchmark. Let's say it's not your benchmark, but an A/B test, and you've applied it to your service, measured it, received 5 million requests per second, and are happy: "Everything is really fast here." But you didn't realize that all these responses were 404, for example. So, you need to calculate errors too.
- Incorrect settings. In my field, in databases, this is a common problem because the default Postgres settings assume you're trying to run it on a microwave. Servers are powerful now, so all default settings need to be drastically adjusted. Explore buffers more, increase work_mem. And understand what these settings do. If you see a benchmark, even with the data it was tested on, and even with scripts, but it says "we tested with default settings," then that's the default for MongoDB and Postgres—that's it, you can close it. Default settings are not a useful way to understand what's faster.
- Atypical workload. You spend 90% of your time reading something, 10% writing something, and you decide: let's write a benchmark that does both. Why test something like that? So you're optimizing something, but it won't help you much in production.
- Marketing and customization. I have a little cool story here. I know for a fact that about …ty years ago, there were hardware manufacturers who knew the benchmarks a certain magazine used to test computers. They designed their hardware to look good on these benchmarks. As a result, everything sold very well. This is the first method of customization.
Another method of customization—we can cite MongoDB. They always run their benchmarks on small DataSets, so everything fits in memory and works great. When your DataSet no longer fits in memory, everything stops working well.
So, you need to understand that this exists, it's not an illusory thing. - Well, and other properties. A familiar example: Oracle vs. Postgres—which is faster? Oracle might be 10 times faster, but it's also incredibly expensive. That's something to consider, too. Or maybe not—I've never benchmarked Oracle and, frankly, I've never even seen it.
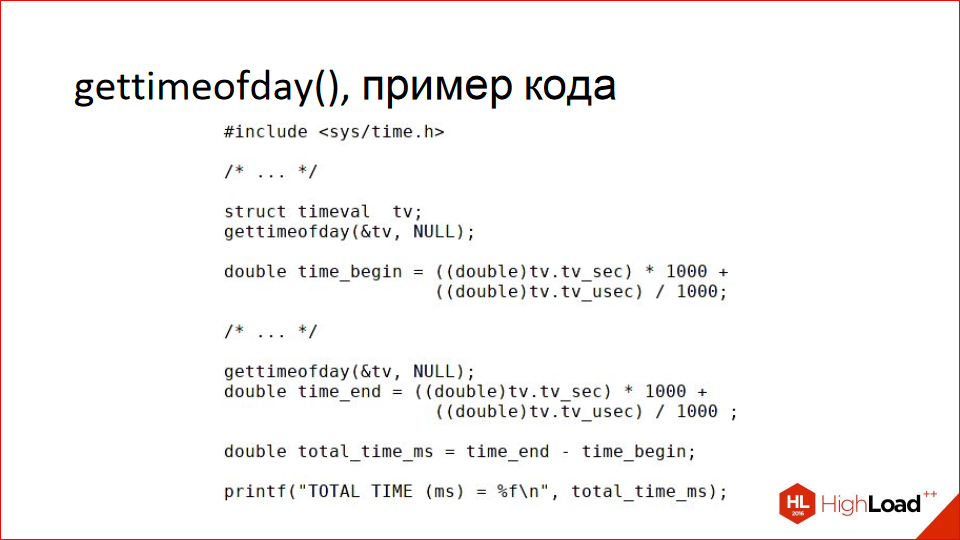
To give you a complete picture, I'll start with how not to benchmark code. The simplest way is gettimeofday(). The old-fashioned method, when we have a piece of code and want to find out how fast or slow it is, we measure the start time, execute the code, measure the end time, calculate the delta, and conclude that the code takes that long to execute.
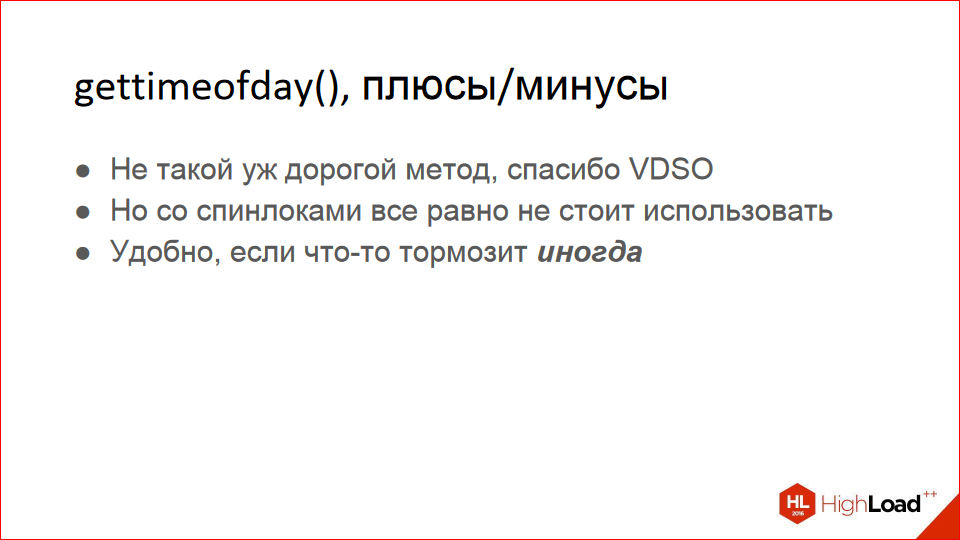
It's not really the most idiotic method; it's convenient, for example, when your code occasionally stalls, that is, very rarely—once in 10,000 requests, for example. Plus, it's not as expensive as you might think, since you're not actually performing a system call. In Linux, this mechanism is called VDSO. Essentially, you have a kernel page that's mapped into the address space of all processes, and your gettimeofday() turns into a RAM access; no syscall occurs.
Even though it's cheap, you shouldn't use it if you're doing anything with spinlocks. Because spinlocks themselves are pretty fast. That is, what you're measuring must execute for at least milliseconds, otherwise you'll have measurement-level error.
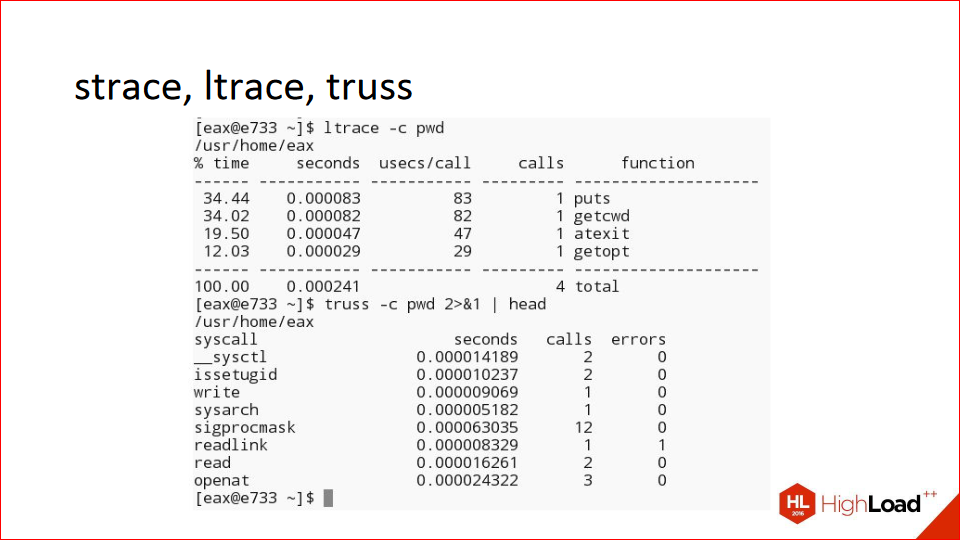
Tools like strace, ltrace, and truss are cool; they have a -c flag that shows how long each syscall took to execute. Well, ltrace measures library routines, and strace measures syscalls, but they can also be handy for certain tasks. I can't say I use it often.
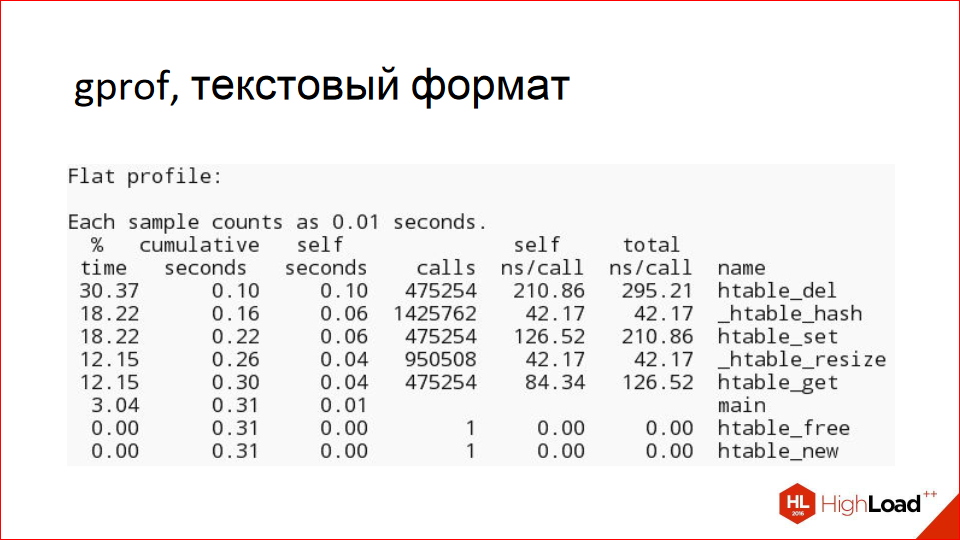
Gprof is a cool tool; the slide shows an example of its text report. It's also clear: here are the routines in a program, here's how many times they were called, and that's how long they took to execute as a percentage. It's a simple, clear report; if you've written a microbenchmark, you can use it.
You can also use gprof to generate images like this:
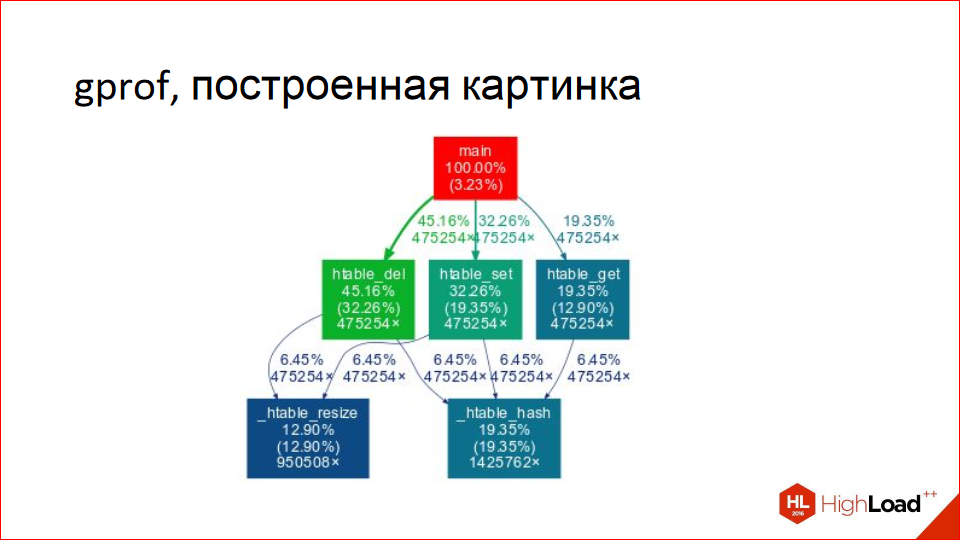
This is more of an example of what not to do. Remember this image; there are six squares. Notice how much space they take up. These are the procedure names, and there's always something written above the arrows that's unclear—it takes up a lot of space. We'll see much more descriptive reports than this. But, in principle, it's a pretty image; you can show it to your boss, show off.
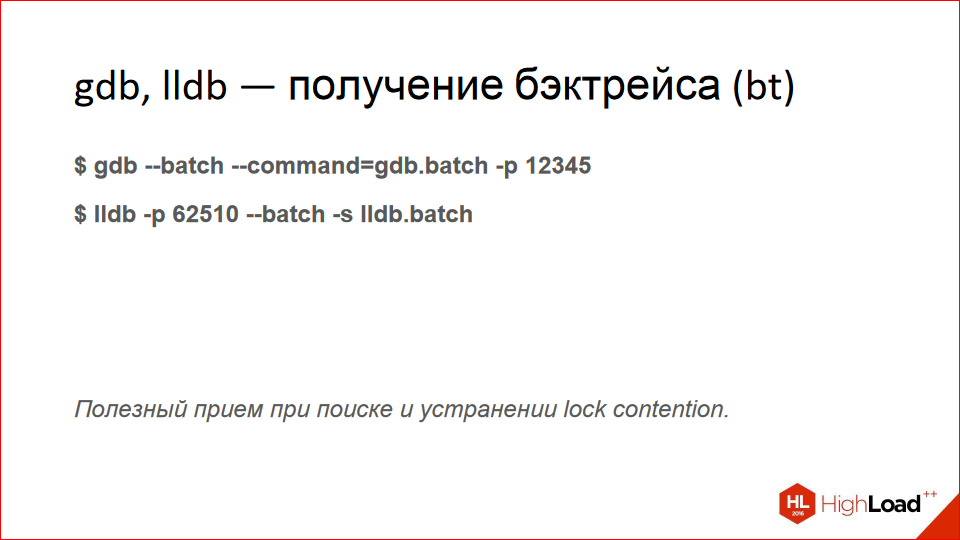
Debuggers. In fact, this is already an example of the tools that are actually used in profiling, because they have the cool ability to execute commands in batch, and you can write a backtrace to this set of batch commands (bt). This is very useful for debugging lock contention, when you're having a lock-fight.
http://habr.ru/p/310372/
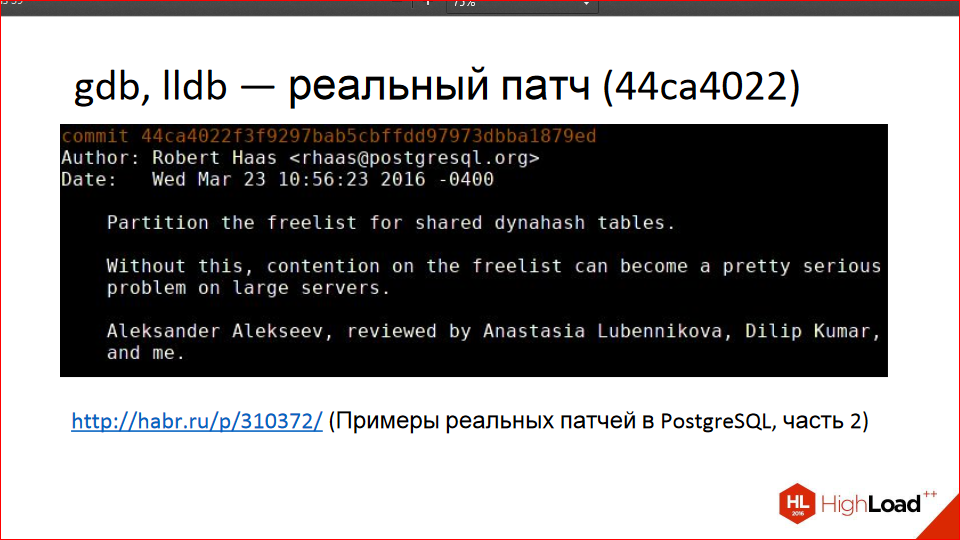
I have a little cool story here. I think it was the very first patch I wrote for Postgres. Or maybe the second, I can't remember. Postgres has its own hash table implementation, heavily tailored to Postgres-specific needs. And it can, among other things, be created with flags to allow it to be used by different processes. A client came to me with a problem like, "I'm having problems with such-and-such queries, in such-and-such a scheme, please help." Interestingly, at first, using the backtrace trick, it looked like you were running gdb 10 times, and in five cases the backtrace would hang on lock acquisition, and in the other half, on something else. So, clearly, your process was frequently hanging on lock acquisition; something was wrong.
By the way, we've made video recordings from the last five years of the HighLoad++ high-load systems developer conference publicly available . Watch, study, share, and subscribe to our YouTube channel .
Using the backtrace, I was able to find the code that was constantly acquiring and releasing the lock. It's a long story; you can read the article on Habr by following the link. There's also a link to a discussion on hackers that covers the technical details.
The slide above shows a chunk of code between acquiring and releasing the lock; it, in turn, was dumped somewhere into dynahash, where it was spinning while acquiring a spinlock. Using debuggers, I was able to find this, fix it, and propose a patch. And the spinlock in dynahash (a hash table in Postgres) was converted into 8 or 16 spinlocks, each of which is acquired differently under certain conditions. I was able to shard it, and this is already included in 9.6.
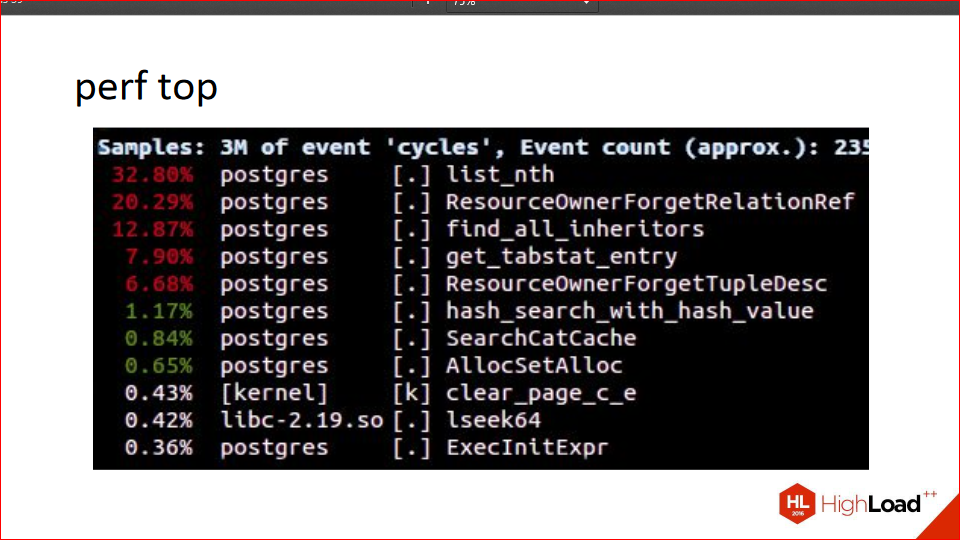
Perf is a wonderful tool because perf top shows the top procedures. In this case, in the specified process, how long they take to execute. At the top, we see 30%, 20%, and we see ResourceOwner—it's not by chance that these procedure names are there, because the next cool story is also about a real patch.
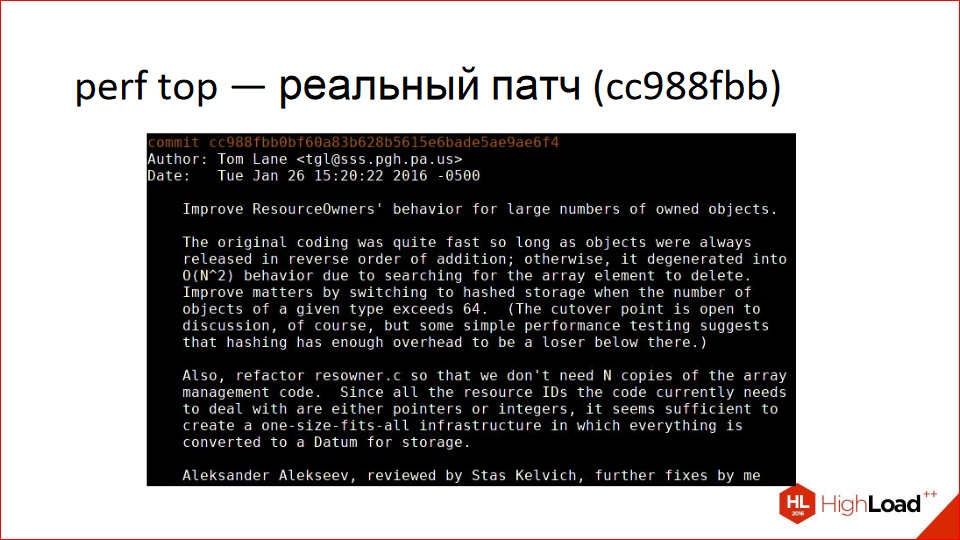
A client came in and said, "I have these queries and this schema. Everything's lagging. What should I do?" We started debugging. He has an enterprise application with tables, a thousand child tables (Postgres, for those unfamiliar, has table inheritance). And using perf top, we see that everything is lagging in ResourceOwner. ResourceOwner is an object (as far as the word "object" is applicable to the C language) that stores various resources, files, shared memory, and other things. And it's written with the assumption that we typically allocate resources and put them in an array, and deallocate them in reverse order. Therefore, when deleting resources, it starts searching for them from the end. It knows the size of the array—well, in the sense that it has the index of the last element. It turns out this condition isn't always met, and it has to search the array in all directions, causing it to stall. The patch is that at a certain number of resources (around 16 or something like that), the array is converted into a hash table. When you resolve a conflict, you use the hash to find the specified array index, and then proceed in one direction.
By the way, if anyone's wondering who writes their own hash tables in the third millennium, I'm sitting here writing my own hash tables in two patches because the standard implementations aren't suitable. This is also already in 9.6, and ResourceOwner doesn't stall there if you have a highly partitioned table. I mean, it still stalls, but less so.
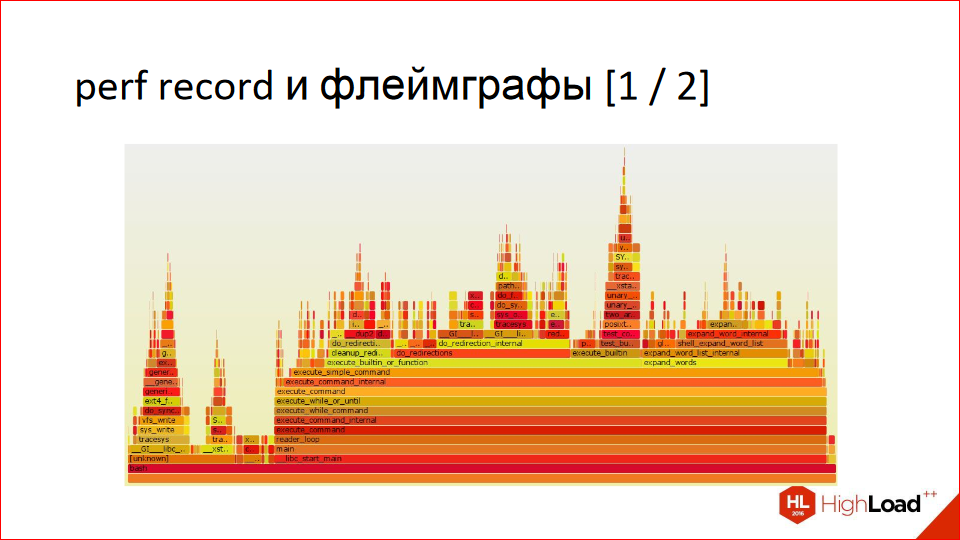
With perf, you can create these beautiful images called flamegraphs. They're read from bottom to top. At the bottom, we have a procedure, then—proportionally, depending on how much time it spends where and, in turn, calls—we divide it among other procedures. Then we go up, and we also divide it proportionally depending on how much time it spends where. And so on. It's very visual, but it might be unusual if you're seeing it for the first time. In fact, it's a very visual report, much more visual than the graph example that Gprof creates. Notice how economically space is used; you can't show this on the slides, but you can click on everything. And it has a tooltip that shows percentages.
Here's a zoomed-in section, somewhere in the middle:
Actually, that's probably all. We use this a lot. At our previous job, we analyzed logs in the same way. That was a different story—we had an AK cluster, a distributed application, and we used the logs to build things like this, trying to figure out where our code was slowing down. Logs, of course, needed to be aggregated from all backends. Overall, it's a handy tool, I recommend it to everyone.
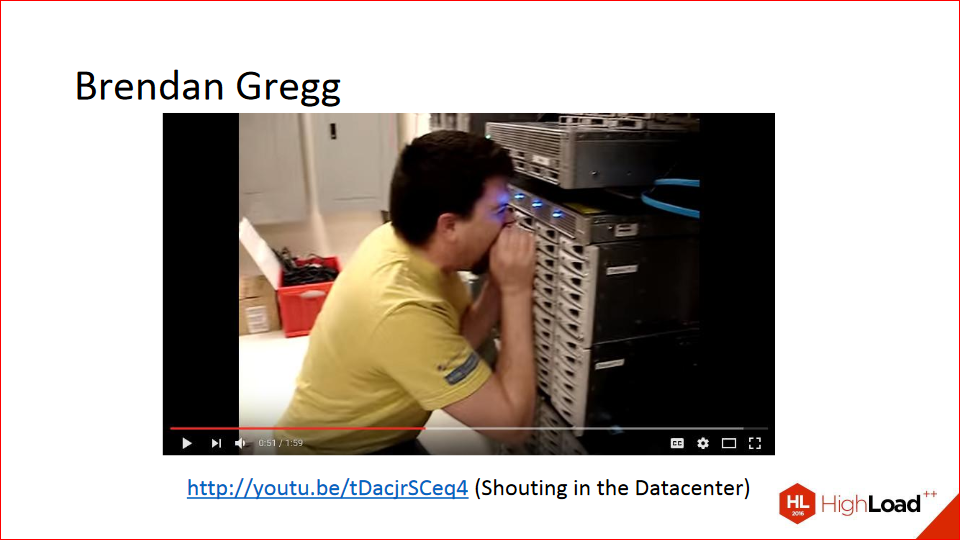
This is Brandon Gregg. He invented flame graphs and practically perf itself. He probably wasn't the only one writing it, but he contributed significantly to it. He's also known for his YouTube videos where he yells at hard drives in a data center, and his latency increases when accessing those drives—a great video. If anyone's interested, this is a real thing, though I don't know whether it works with SSDs.
There was a similar story recently about how, during a fire drill at a bank, the entire data center went down because the pipes that supply the gas that extinguishes the fire were too loud. In other words, the air vibration knocked out all the drives.
We'll come back to Brandon later, because he knows everything about profiling and has invested a lot in it; he's now working on it at Netflix.
http://eax.me/freebsd-pmcstat/
Pmcstat is a FreeBSD-only tool. When I made these slides, I assumed no one would have FreeBSD, so I won't go into much detail about pmcstat here, as it's not very interesting to most people. But the short version is that it can do everything you can do with perf. It also runs top, it also builds flame graphs, and it's just as good, it just uses different commands. For those interested, here's a link to the specific article.
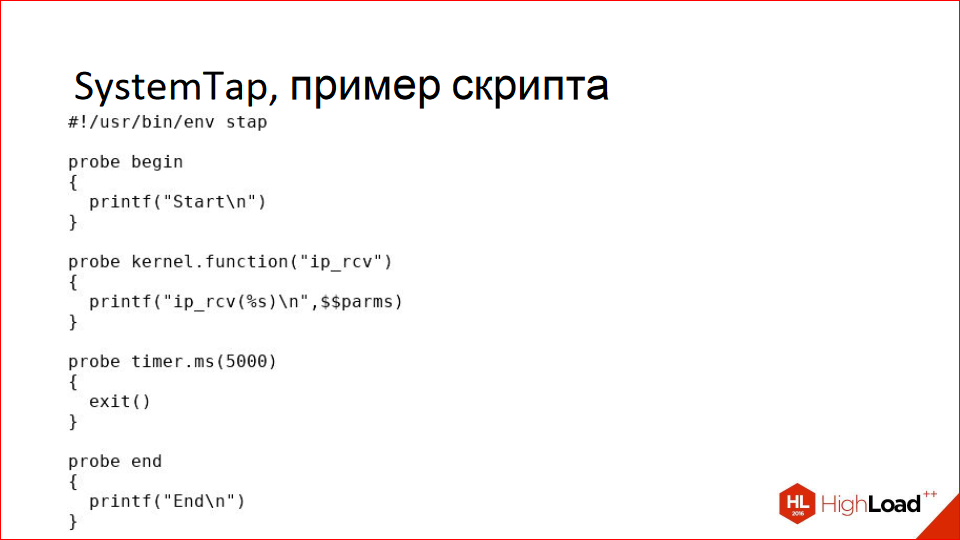
Let's move on to more serious tools. SystemTap. Above, we focused on CPU profiling, which shows where something is slowing down, but SystemTap lets you do even more—you can look at literally anything in the kernel, measure how many packets are being sent over the network, measure disk access, and anything else you want, the only limit is your imagination. SystemTap lets you write scripts like these; in this case, it traces the ip_rcv call, meaning the receipt of an IP packet.
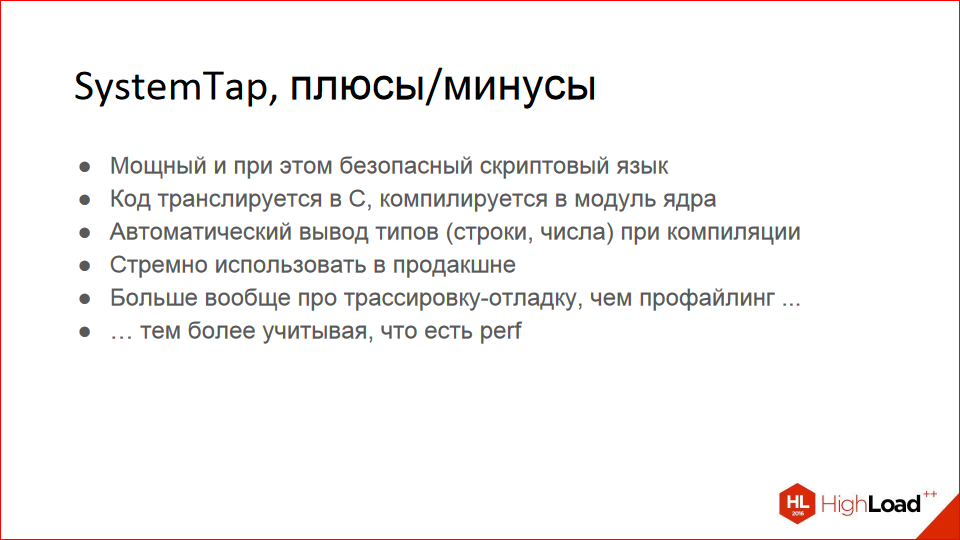
Pros and cons. There are two main cons. First, it's not an official Linux tool; the guys at Red Hat created it primarily for themselves, for debugging their code, as I understand it. It's very inconvenient to install; you need to download a package with kernel debug symbols, then install it, then compile SystemTap itself, which takes a long time. It's also not easy to compile; you need versions. But eventually, it starts working. The second drawback is that you need a good understanding of the underlying code you want to analyze and trace. Not everyone knows the Linux kernel by heart. But if you know your code well, you can use it.
It has an interesting property: the code is translated into C, then compiled into a kernel module, which is loaded and collects all the statistics, tracing everything. This means you don't have to worry about dividing by zero or dereferencing invalid pointers. If you write this in a scripting language, it won't crash the kernel; it'll just gently fold and unload, but your kernel will continue to run.
There's automatic type inference. True, there are only two or three types, but they're inferred automatically.
Personally, I'd be wary of using this in production because it doesn't feel like a stable tool. The simple fact is, your script takes about 10 seconds to compile and load, and it's not entirely clear what's going to slow it down during that time. I wouldn't risk it, but maybe you're more daring.
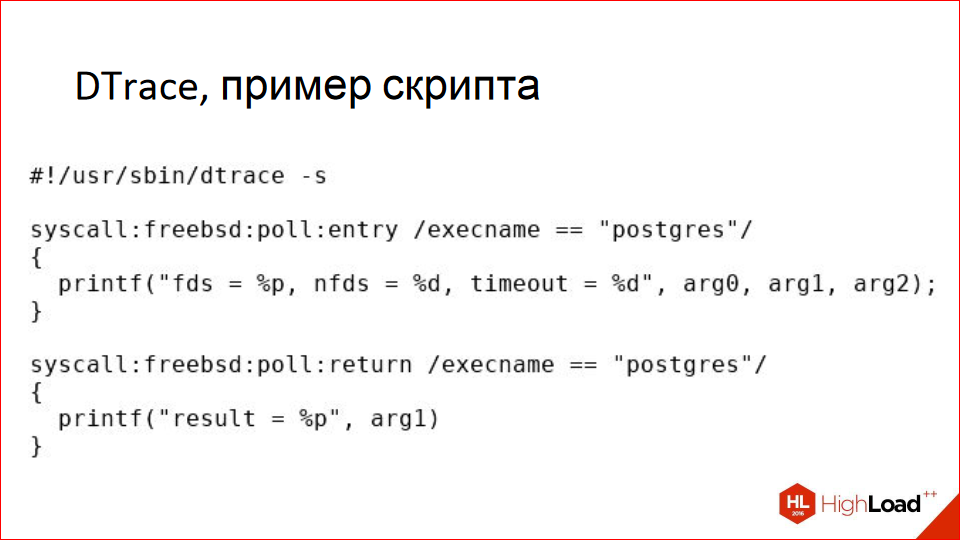
DTrace is also a cool tool, not just for FreeBSD; it's also available for Linux, and it's all good. It's similar to SystemTap; in this example, we're tracing the poll system call, specifically for processes named postgres. It traces the arguments it's called with and what's returned.

There are pros and cons. First, unlike SystemTap, it's included with the system out of the box; you don't need to install or compile anything. It's available for FreeBSD and Mac OS. It's also available for Linux if you're using Oracle Linux. There's also the dtrace4linux project on GitHub; I've tested it and it compiles and works. Basically, you can use it.
Unlike SystemTap, DTrace is safe to use in production—log into your Mac in production and trace anything you want. In my personal opinion, DTrace is more for admins because the kernel has a ton of probes for everything you could want, and you don't need to know the codebase; you just say, "I want to collect IP packet statistics—how many came in, how many went out." By the way, there are ready-made utility suites; you don't necessarily need to write everything yourself. It's called DTrace Toolkit.
SystemTap isn't really for admins, but for developers: "I know the kernel code, I want to trace this place, without writing any code or patching it."
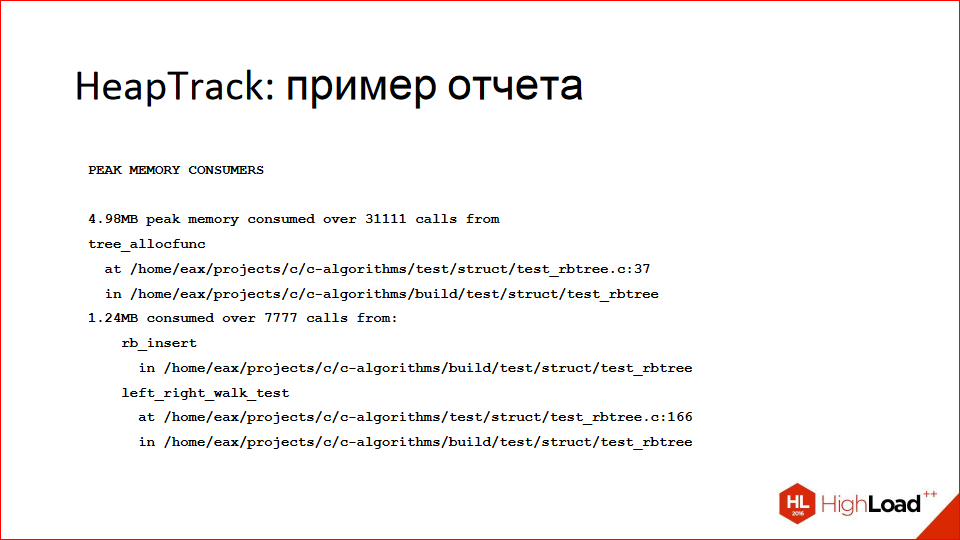
So far, we've been talking about profiling in terms of CPU usage, but another common problem is "what if I'm consuming a lot of memory?" I personally like the HeapTrack tool. If you've ever used Valgrind or Massif, it's similar, only faster, but with a limitation—it only works on Linux.
Here (on the slide above) is an example of a text report; it found the location that's consuming the most memory, with specific line numbers, source file names, and so on.
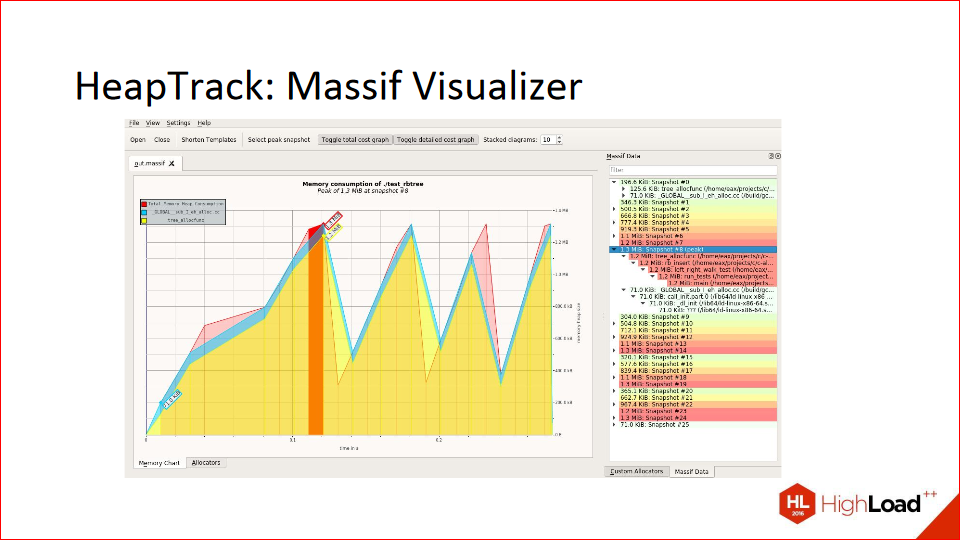
It can also generate beautiful reports in the Massif Visualizer tool. You can open everything in it, and it all plays out dynamically. Memory usage grew, then peaked, then began to decline, was freed, allocated, and there are traces on the right. Everything is very visual and beautiful.
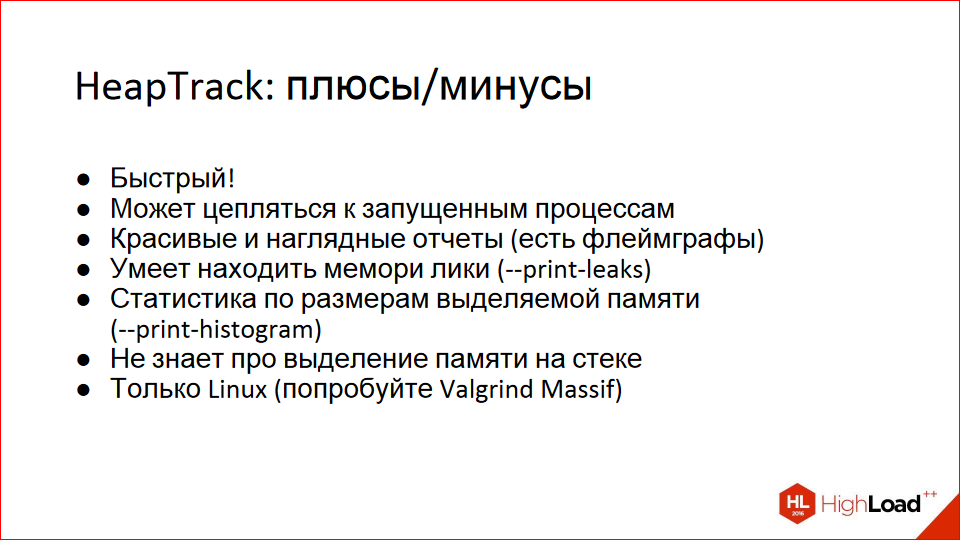
Pros and cons. It's fast, unlike Valgrind. It can latch onto running processes, and you can run processes under it. Beautiful reports. It can find memory leaks. It's a bit iffy at finding them; if your standard language library allocated 16 KB for some internal needs and then didn't free them because "well, why?", it'll say it's a memory leak. But it's actually a pretty useful tool, despite all that.
You can build a histogram, and it shows that 8-byte chunks are allocated the most, while 32-byte chunks are allocated a little less often. It produces a pretty histogram.
It doesn't know anything about the stack; if you need a stack or something outside of Linux, use Valgrind. I'm a Linux user, so I don't know anything about Valgrind.
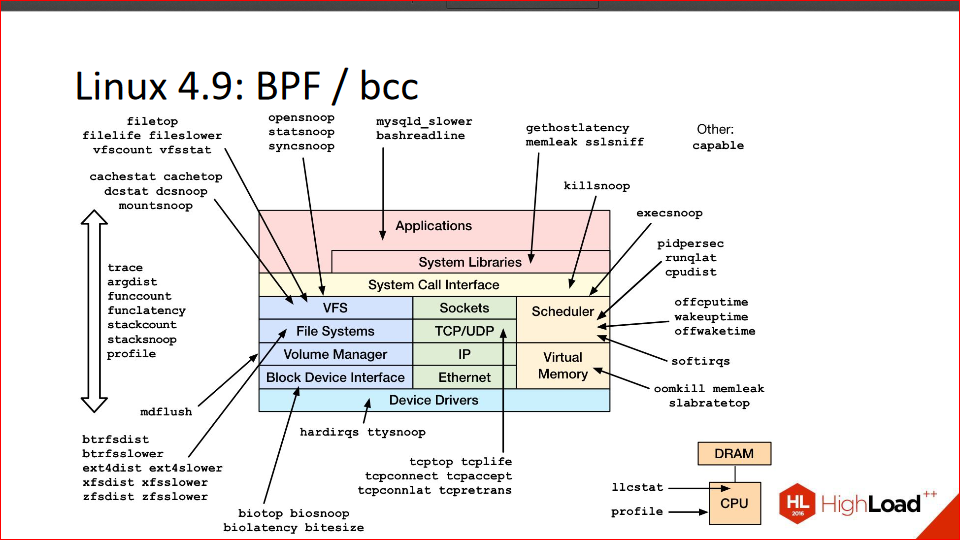
There's a topic in Linux called BPF; it was originally called Berkeley Packet Filter, and, as you might guess from the name, it has to do with Berkeley and some packet filtering, but BPF landed somewhere around the 2.6 branch. But eventually, it was refined and, in essence, transformed, with some help from the aforementioned Brandon Gregg, into DTrace for Linux.
It allows you to do absolutely everything that's exactly the same. Brandon recently wrote a blog post where he wrote that the final changes to BPF have landed in the 4.9 kernel, which is still a release candidate but will be soon. There won't be any major changes; they might refactor something, maybe tweak it a bit, but they won't be actively adding anything.
Bcc is a set of utilities that uses BPF to profile various parts of the kernel. In the picture, these are all the utility names. You can essentially trace and profile any part of the kernel.
The downside of BPF is that it doesn't yet have its own scripting language, like DTrace and SystemTap, but there are already some developments in this direction. In particular, the guys from Red Hat got involved, took their SystemTap and built it for BPF. That is, it uses the SystemTap language, but it runs on BPF. It's still somewhat limited and doesn't support strings at all, but they're working on it.
The point is that BPF seems to be our distant, bright future, and it's the highest common denominator that all companies have ultimately arrived at. Facebook had some scripts, Red Hat had SystemTap because they needed tracing for development. They solved their problem and don't need anything else. But BPF is what should ultimately solve everyone's needs, and it's already out of the box in the kernel, and it seems everyone will eventually come around to it, and in a couple of years, great happiness will arrive.
The main question that worries millions is: "Okay, so there are so many tools, but which should I use and when?" What I personally use is debuggers. If you suspect lock contention, it's pretty easy to spot. You won't see anything hogging a lot of time in perf top; it's probably hanging in locks. Perf, if you think you're stuck on the CPU, you can see it in regular htop—there's a process consuming a lot of CPU. Pmcstat, if you're on FreeBSD, SystemTap seems useless to me because perf is more convenient. I'm talking about profiling specifically; I can profile with perf, but SystemTap is okay for tracing, but it's not really about profiling.
DTrace—if you're on a Mac, it's your everything, because it can do everything.
HeapTrack is for memory, Vagrant Massif is for Linux, and BPF has a bright future, but right now I wouldn't put 4.9 in a product, but maybe you're braver.
I'd recommend books co-authored by Brandon Gregg.
The first one, Systems Performance: Enterprise and the Cloud, is an amazing book; everyone should definitely read it. This is one of the best programming-related books I've ever read. It blew my mind, then it hit my colleagues like shrapnel, so just read it.
The second book about DTrace is also by Brandon Gregg, co-authored with a guy I don't know what's special about him. I didn't read it, but I skimmed through it; it's a huge collection of DTrace recipes. It gives a command and what it does, along with example scripts. It goes on for a thousand pages. I don't think it's particularly interesting reading, but if you're really interested in DTrace, skimming through it in the evening won't hurt.
There are tons of online resources:
- This is a link to my blog ;
- http://www.brendangregg.com/blog/index.html - Brendon Gregg's blog - definitely subscribe, he posts some mind-blowing stuff there.
- http://dtrace.org/blogs/ — I also read the DTrace blog, there are interesting articles there.
- Next. https://sourceware.org/systemtap/ is SystemTap's website.
- FreeBSD on the wiki - https://wiki.freebsd.org/DTrace
- You can also read about DTrace in the handbook. Even if you use a Mac, you should still browse the handbook; there are some good examples there— https: //www.freebsd.org/doc/handbook/dtrace.html
- And finally, there's the Intel manual: http://www.intel.com/content/www/us/en/processors/architectures-software-developer-manuals.html . There you can read about what perf exploits, what PMC is, and the instructions right in the processors that allow you to measure all of this.
That's all I have.
This report is a transcript of one of the best presentations at the HighLoad++ high-load systems developers conference . Less than a month remains until the HighLoad++ 2017 conference.
We have the conference program ready , and we are actively developing the schedule.
This year's presentations tagged " The Right Hands ":
- I Want to Compress Everything / Andrey Aksenov
- DDoS Security at the System Design Stage / Ramil Khantimirov
- What to do in the evening if I know how much ++i + ++i is / Andrey Borodin
- How to Develop a Component Library Without Breaking It / Artur Udalov
We also use some of these materials in our online training course on developing high-load systems, HighLoad.Guide —a series of specially curated emails, articles, materials, and videos. Our textbook already contains over 30 unique materials. Join us!