


Introduction
There are many articles on Habr describing the interesting and complex aspects of web development, but many readers, at the beginning of their web development careers, would like to see material that would help them take the first step from "PHP in 24 hours" to serious development, and I would like to share my experience in this matter.
The specifics of a web application divide it into two parts: client and server. The client side runs JavaScript code (perhaps you can find VBScript somewhere, but we will not consider this case), while the server side runs a variety of other things, in principle, but we will consider PHP, the most popular language for the server side of web applications. It would also be interesting to discuss debugging and profiling Flash applications on the client side, but the topic covered is already extensive, so we will leave that for now.
Also, debugging client-side code can include HTML code analysis and validation. This task, while not strictly related to programming, is nonetheless important.
Some parts of the problems discussed have already been discussed in other articles, and I have provided links to them.
Debugging and profiling client code
The "classic" way to debug JavaScript code is to use functions alertand their derivatives. I remember early in my career, I personally wrote a function print_rfor JavaScript because I couldn't see a way to output debug information for arrays and objects. It looked something like this:
function print_r(variable)
{
if (variable instanceof Array || variable instanceof Object) {
var key;
for (key in variable)
alert(key + ' => ' + variable[key]);
}
else {
alert(variable);
}
}
Of course, there was no talk of any profiling whatsoever.
With this approach, even information about the console object is revolutionary. The specific nature of the client-side web application requires debugging the code in all popular browsers. Of course, debugging in Internet Explorer and any other
is usually sufficient , but we'll consider all options.
Mozilla Firefox
Firefox is arguably the pioneer of client-side code debugging. For a long time, it was considered the most suitable browser for development, thanks to the Firebug extension , which contains arguably all the necessary features except HTML code validation.

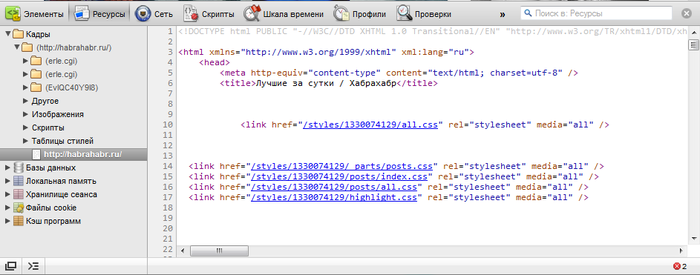
Also, starting with version 4, a built-in Web Console was introduced, which implements some of the functionality of Firebug's "Console" and "Network" tabs, as well as some CSS debugging capabilities.

Starting with version 6, a Simple JavaScript Editor was introduced, which also implements one of Firebug's features and allows you to write and run code directly in the browser.

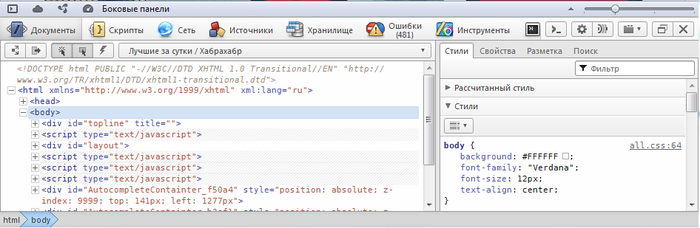
Starting with version 10, Page Inspector was introduced, which allows you to examine HTML code and CSS properties, thus implementing the functionality of the "HTML" tab.
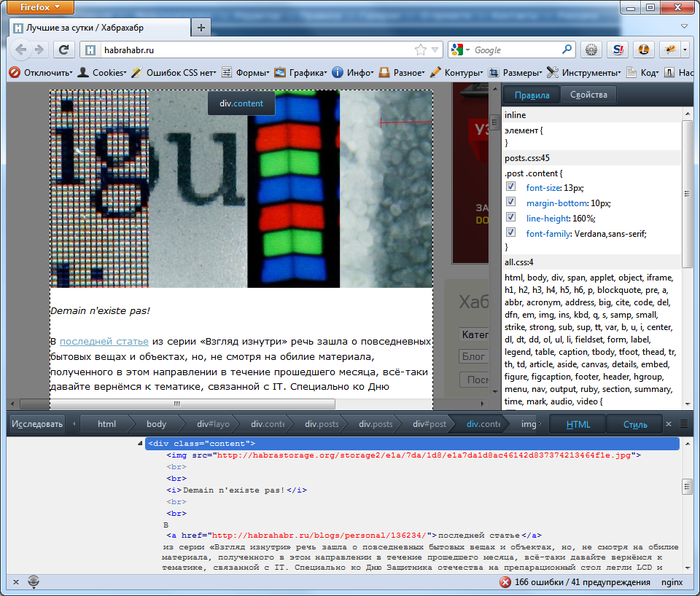
HTML code validation is typically handled by the Html Validator extension . Its icon, indicating the number of errors on the main page of habrahabr.ru, can be seen in the lower right corner of the browser in the image with Page Inspector.
I'd also like to take this opportunity to point out that there are many extensions for this browser that can make life easier, and there's already a corresponding article about this on Habr .
Google Chrome and Safari
These WebKit-based browsers feature a built-in Web Inspector development tool, which is very well developed and implements virtually the same functionality as Firebug. To its credit, it doesn't slow down the browser, as is common with its "big brother."
In Chrome, it can be invoked with keystrokes Ctrl+Shift+Ior simply by pressing F12. In Safari, it's well hidden, and to use it, you need to enable development capabilities in the browser settings. Later, developer tools will become available from the "Development" menu item or by pressing Ctrl+Alt+I. Third-party extensions are also required for HTML code validation. For example, for Chrome, Validity
is an option . We haven't yet found anything suitable for Safari.
Opera
Opera also has a built-in developer tool called "Opera Dragonfly," which can be accessed at any time using a keyboard shortcut Ctrl+Shift+I. It's similar to what WebKit offers and offers similar features and benefits, though I personally find it less user-friendly.
As homm pointed out , Opera offers a simple way to submit a page for validation to validator.w3.org. The context menu for the website display area has an option called "Are web standards followed?", which is responsible for this.
The situation with HTML validation extensions in Opera's catalog is tenuous, so the Validator extension has no alternative.
Internet Explorer
Starting with version 8, Internet Explorer also introduced developer tools. They offer roughly the same capabilities as other browsers, but, as with other aspects of its functionality, Internet Explorer offers them with some unique features and indescribable elegance. Important features include the ability to emulate older versions, as well as a compatibility mode. It's

generally believed that versions 7-, which were the subject of endless tears for web designers and JS programmers, lack such tools. A third-party solution, Companion.JS, exists, and a dedicated article was written about it . While its capabilities are significantly inferior to traditional tools, this tool at least allows for more advanced debugging than "alert-based debugging."
Comrade atd pointed out that these long-suffering versions also had a native tool called the "Internet Explorer Developer Toolbar," but it required separate installation: www.microsoft.com/download/en/details.aspx?id=18359 Comrade k12th
also reminded me that if you have Visual Studio, you can debug code in it (using the "Web Development Tools" components). You can also find information about the free Visual Web Developer Express version .
Debugging and profiling server code
Xdebug
As we agreed at the beginning, we're considering a case where PHP is used on the server. The "classic" debugging methods here are [unclear echo] print_rand var_dump[unclear], but there's also a debugging tool that's right at home: Xdebug . For me personally, due to the specifics of my university studies, it felt "just like Delphi."
The xdebug extension allows you to at least step through your code and view variable values, which takes PHP programming to a new level. There was a dedicated article about the intricacies of working with xdebug . XDebug is usually available in GNU/Linux repositories; on Windows, it's also fairly easy to install by copying a DLL file.
When using this extension, an incoming connection is sent from the server to the developer's computer (by default, to port 9000), which the developer must process. To do this, you need to configure your IDE accordingly.
Incidentally, using an IDE is also a prerequisite for moving forward. Some programmers believe that the difference between programming in a notebook with code highlighting and in an IDE can only be seen on large projects, but I personally believe that the difference is visible even in the "Hello world!" program—the auto-substitution of names and arguments of standard functions alone is worth it.
XHProf
About expansion
Yes, xdebug provides profiling capabilities, but I personally prefer Facebook's XHProf extension for this purpose. I haven't run any tests, but this extension is considered much better suited for production servers and for profiling under real-world loads.
Installation
Unfortunately, this extension isn't included in any repositories. It's included in PECL, but for some reason, installing it the standard way often causes problems. For this reason, installing from source is necessary.
# Получаем исходники
wget http://pecl.php.net/get/xhprof-0.9.2.tgz
# Распаковываем исходники
tar -xvf xhprof-0.9.2.tgz
# Переходим в каталог, где содержится код расширения
cd xhprof-0.9.2/extension/
# Проводим компиляцию и тест
phpize
./configure
make
make test
# Проводим установку цивилизованно
checkinstall
The configuration file xhprof.iniprovides us with options like this:
[xhprof]
extension=/usr/local/lib/php/extensions/no-debug-non-zts-20090626/xhprof.so
; Каталог для логов
xhprof.output_dir="/var/log/xhprof/"
Profiling
The directory we get after unpacking the archive contains, in addition to the extension's source code, a web interface for examining profiling results and libraries for profiling the application.
Let's look at an example of profiling. The following elements need to be included in the application code:
// Начало скрипта, включаем профилирование
// как нагрузки на процессор, так и на память
xhprof_enable(XHPROF_FLAGS_CPU + XHPROF_FLAGS_MEMORY);
/*
* Основной код приложения
*/
// Конец скрипта, завершаем профилирование,
// записываем результат в лог
$xhprofData = xhprof_disable();
include_once XHPROF_DIR.'/xhprof_lib/utils/xhprof_lib.php';
include_once XHPROF_DIR.'/xhprof_lib/utils/xhprof_runs.php';
$xhprofRuns = new XHProfRuns_Default();
$namespace = 'some-unique-name';
$runId = $xhprofRuns->save_run($xhprofData, $namespace);
echo "<!-- ", $runId, ' ', $namespace, " -->\n";
Here, the constant XHPROF_DIRpoints to the directory where we unzipped the downloaded archive.
To analyze the results, we need the web interface. It can be found in the directory $XHPROF_DIR/xhprof_html/—let's denote it as such. For example, if we placed it in a location accessible to the web server and it's accessible at example.com/system/xhprof/, then to analyze the results, we need to access it as follows:
example.com/system/xhprof/?run=%runId%&source=%namespace%
We'll get a result like this: Profiling can be included in the application code on a regular basis, or, for example, it can be set to run randomly with a certain probability or when a certain condition is met. For example, like this:

$needProfiler = (mt_rand(0, 100) < 10 or isset($_COOKIE['xhprof']));
if ($needProfiler)
xhprof_enable(XHPROF_FLAGS_CPU + XHPROF_FLAGS_MEMORY);
In this case, if you have customer complaints or suspicions, you can access profiling results for a specific time period. Using this parameter namespace, you can determine which specific part of the application (which script, controller, or action) was profiled.
Profiling SQL queries
Database interactions are typically the application's bottleneck. For this reason, query profiling is recommended. For example, let's consider part of a class that wraps the mysql extension's functions. Yes, I know this extension is not very popular and is being wished dead no less than good old IE6. I'm not advocating for its use; I just happen to have such a class handy.
/**
* Запрос
* @param string $sql Запрос
* @param array $params Параметры
* @param string $query Скомпилированный запрос
* @return array Результат
*/
public function query($sql, array $params = array(), &$query = '')
{
$start = microtime(TRUE);
// Проведение запроса, включая "защиту" параметров
$stop = microtime(TRUE);
$time = $stop - $start;
$this->_addProfilerData($sql, $time);
// Возврат результата
}
private function _addProfilerData($query, $time)
{
if (is_array(self::$profilerData)) {
self::$profilerData[] = array(
'query' => $query,
'time' => $time
);
}
}
public function __destruct()
{
if (is_array(self::$profilerData)) {
$this->_writeProfilerData();
self::$profilerData = FALSE;
}
// Отключение от БД
}
private function _writeProfilerData()
{
$values = array();
foreach (self::$profilerData as $row) {
$query = mysql_real_escape_string($row['query'], $this->con);
$time = (float)$row['time'];
$hash = crc32($row['query']);
$values[] = "($hash, '$query', $time)";
}
if ($values) {
$strValues = implode(', ', $values);
$sql = "INSERT DELAYED INTO `profiler_queries` (`query_hash`, `query`, `work_time`) VALUES $strValues";
@mysql_query($sql, $this->con);
}
}
Here, query profiling data is stored in a table profiler_queries. This table can be of the MyISAM or Archive type, as they support lazy inserts, which avoids unnecessary response latency during profiling. Also, to improve query search, it's best to create a column of the type in the table INT, which will contain the crc32 hash of the query on which the index is to be created.
Conclusion
This article has turned out to be quite long. I may have skimmed the surface and touched on topics that have already been covered, but if I had read something similar back then—an article that brought all the information together and provided useful links—it would have been invaluable. I hope that my article will also help someone on their path to enlightenment.