


Sometimes you need to profile a program's performance or memory usage in a C++ program. Unfortunately, this is often not as easy as it might seem.
This article will cover the specifics of program profiling using valgrind and Google perftools . This material is not very structured; it's more of an attempt to compile a knowledge base "for personal use" so that in the future you won't have to frantically remember "why this isn't working" or "how to do that." It's likely that not all non-obvious cases will be covered here; if you have anything to add, please leave a comment.
All examples will be run on a Linux system.
To analyze the profiling features, I will run small programs, typically consisting of one main.cpp file and one func.cpp file with an include.
I will compile them with the g++ 8.3.0 compiler .
Since profiling unoptimized programs is a rather strange undertaking, we will compile with the -Ofast option , and to get debug symbols in the output, we will not forget to add the -g option . However, sometimes instead of normal function names, you can see only obscure call addresses. This means that "address space layout randomization" has occurred. This can be determined by calling the nm command on the binary. If most addresses look something like 000000000000030e0 (a large number of leading zeros), then this is most likely it. In a normal program, addresses look like 0000000000402fa0. Therefore, you need to add the -no-pie option . As a result, the full set of options will look like this:
-Ofast -g -no-pie
To view the results, we will use the KCachegrind program , which can work with the callgrind report format.
The first utility we'll look at today is callgrind . This utility is part of the valgrind tool. It emulates every executable instruction in a program and, based on internal metrics about the "cost" of each instruction, produces the desired conclusion. Because of this approach, callgrind sometimes fails to recognize the next instruction and fails with the error "
Unrecognized instruction at address.
" The only solution to this problem is to review all compilation options and try to find the interfering one.
To test this tool, let's create a program consisting of one shared and one static library (we'll discard these libraries in other tests). Each library, as well as the program itself, will provide a simple computational function, for example, calculating the Fibonacci sequence.
static_lib
shared_lib
main
We compile the program and run valgrind as follows:
valgrind --tool=callgrind ./test_profiler 100000000
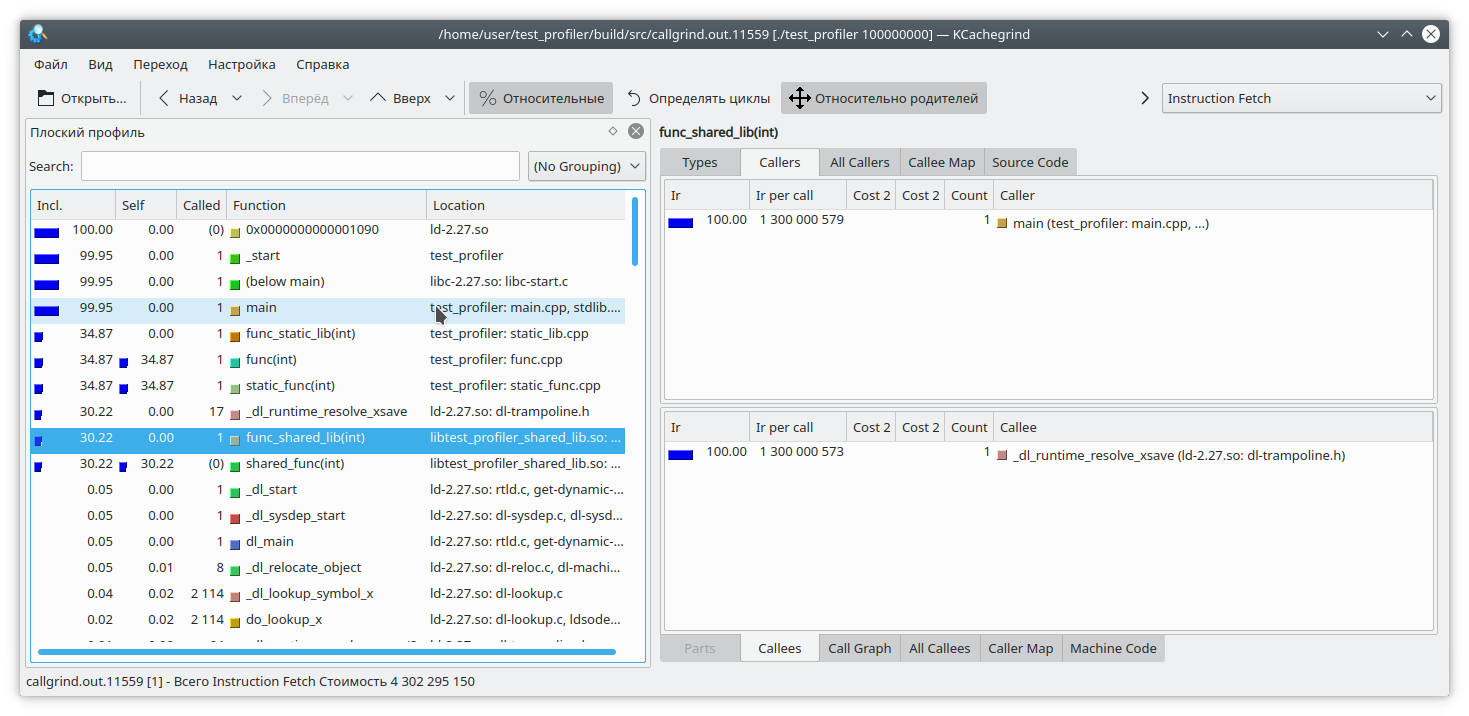
We see that the result for the static library and the regular function is similar to what we expected. However, in the dynamic library, callgrind was unable to fully resolve the function.
To fix this, set the LD_BIND_NOW variable to 1 when starting the program, like this:
LD_BIND_NOW=1 valgrind --tool=callgrind ./test_profiler 100000000
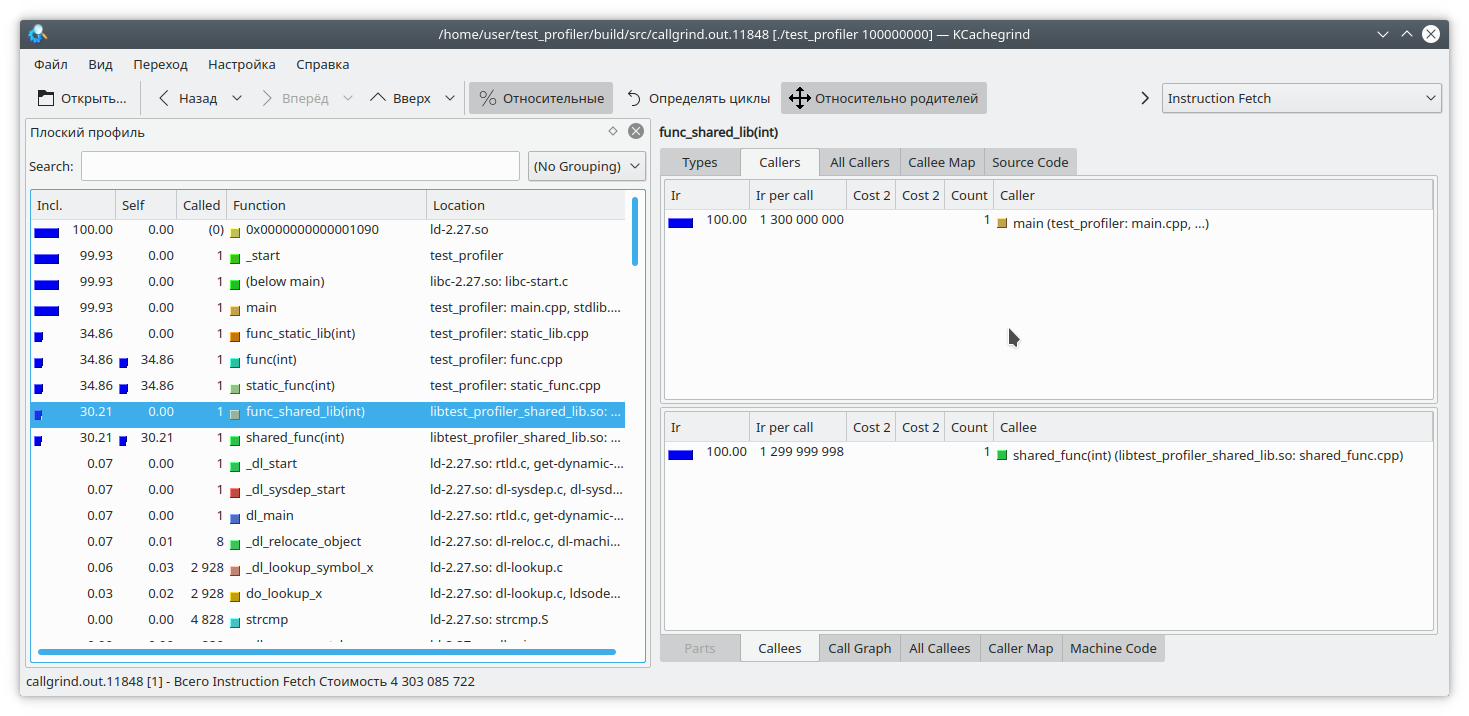
And now, as you can see, everything is fine.
The next problem with callgrind, arising from profiling using instruction emulation, is that program execution slows down significantly. This can lead to incorrect relative estimates of execution time for different parts of the code.
Let's consider the following code:
int func(int arg) {
int fst = 1;
int snd = 1;
std: fstream file("tmp.txt");
for (int i = 0; i < arg; i++) {
int res = (fst + snd + 1) % 19845689;
std::string r = std::to_string(res);
file << res;
file.flush();
fst = snd;
snd = res + r.size();
}
return fst;
}
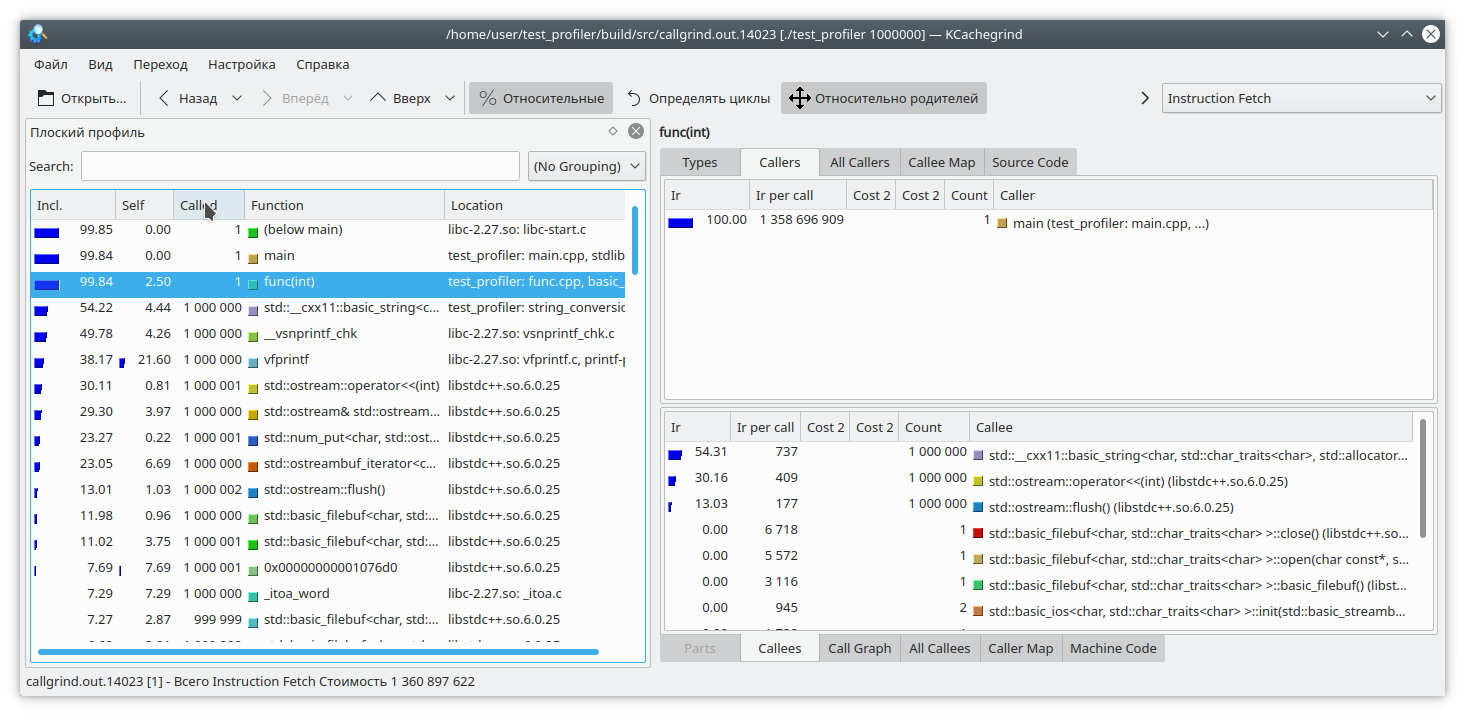
Here, I've added a small write to a file for each loop iteration. Since writing to a file is a fairly time-consuming operation, I've added a string generation from a number to each loop iteration to counterbalance the cost. Clearly, in this case, writing to the file takes longer than the rest of the function's logic. But callgrind has a different take: It's also worth noting that callgrind can only measure the cost of a function while it's running. If the function isn't running, the cost doesn't increase. This complicates debugging programs that occasionally lock up or interact with a blocking filesystem/network. Let's check:

#include "func.h"
#include <mutex>
static std::mutex mutex;
int funcImpl(int arg) {
std::lock_guard<std::mutex> lock(mutex);
int fst = 1;
int snd = 1;
for (int i = 0; i < arg; i++) {
int res = (fst + snd + 1) % 19845689;
fst = snd;
snd = res;
}
return fst;
}
int func2(int arg){
return funcImpl(arg);
}
int func(int arg) {
return funcImpl(arg);
}
int main(int argc, char **argv) {
if (argc != 2) {
std::cout << "Incorrect args";
return -1;
}
const int arg = std::atoi(argv[1]);
auto future = std::async(std::launch::async, &func2, arg);
std::cout << "result: " << func(arg) << std::endl;
std::cout << "second result " << future.get() << std::endl;
return 0;
}
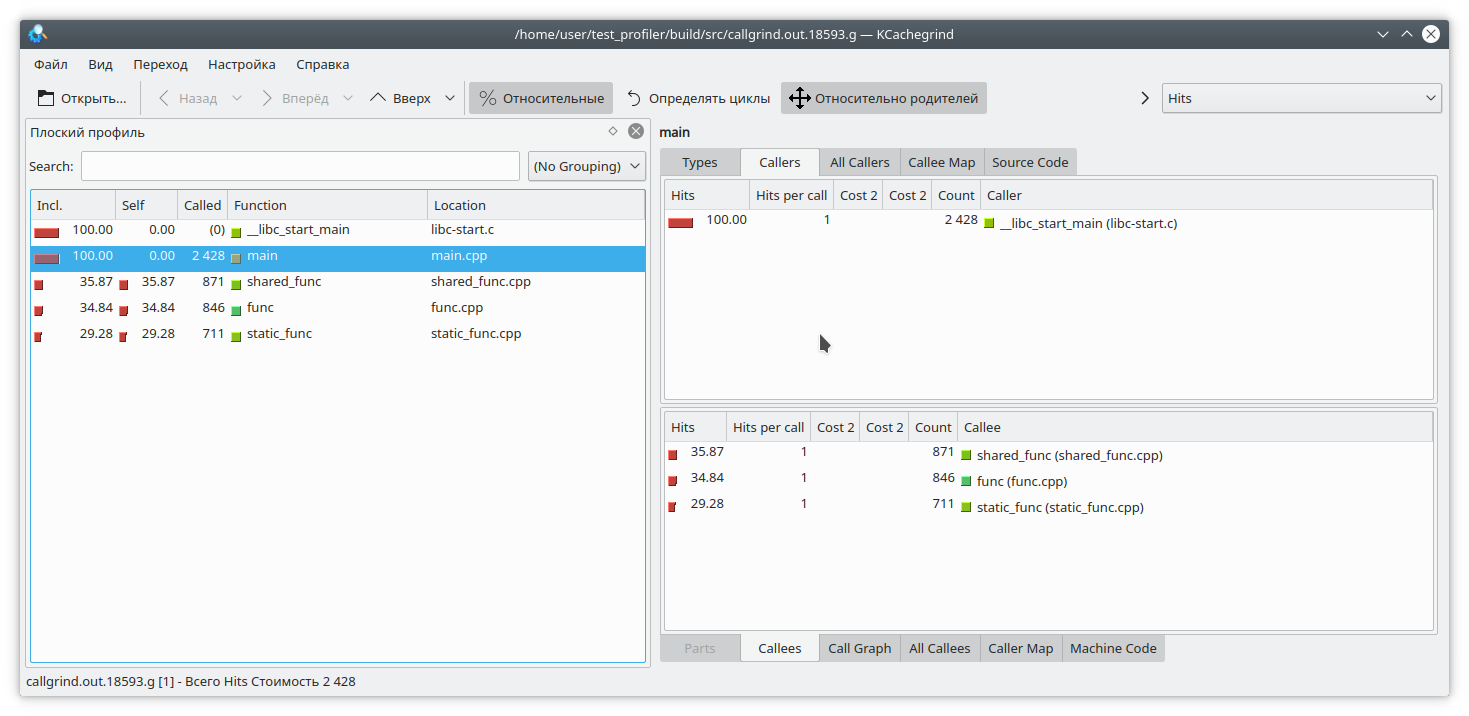
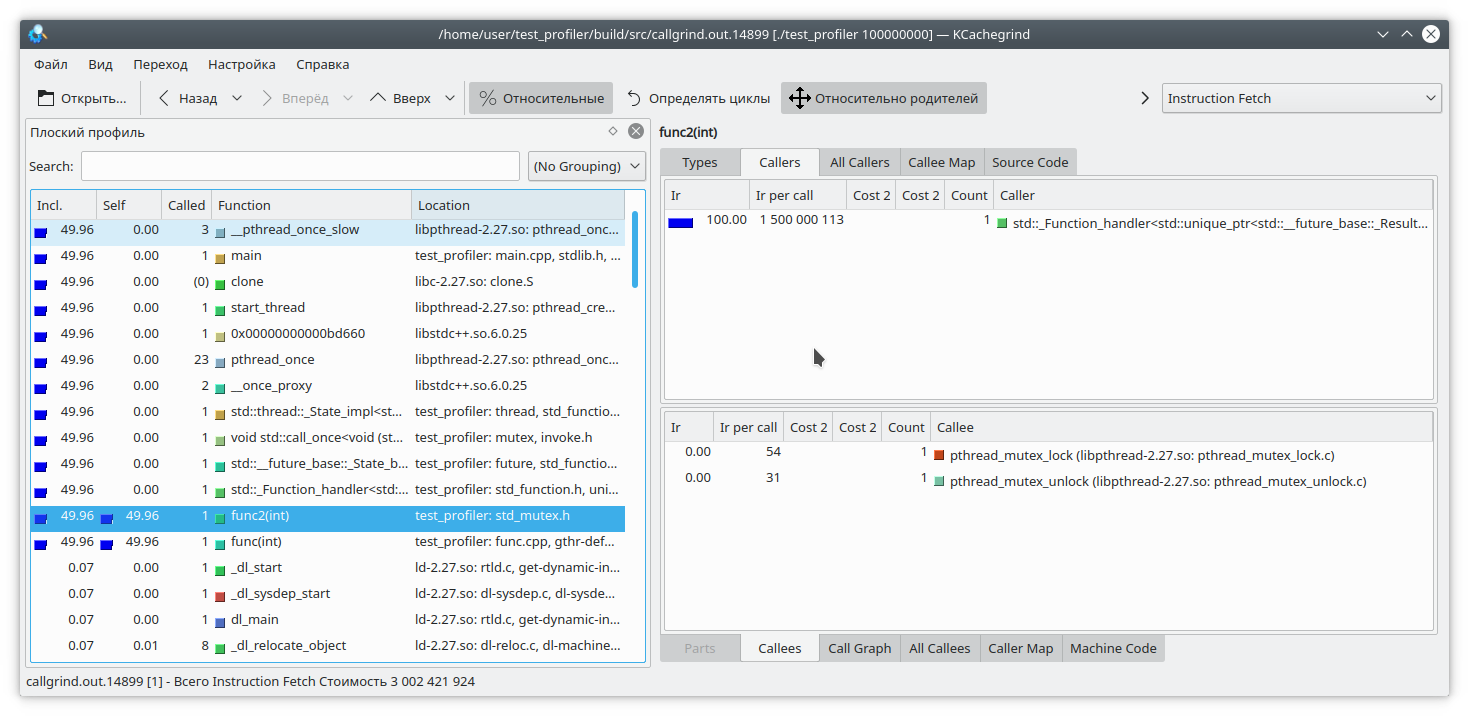
Here, we've nested the entire function execution within a mutex lock and called this function from two different threads. The callgrind result is quite predictable—it doesn't see a problem with the mutex lock: So, we've covered some of the issues with using the callgrind profiler. Let's move on to the next test subject—the Google perftools profiler.

Unlike callgrind, Google's profiler operates differently.
Instead of analyzing every instruction of an executable program, it pauses execution at regular intervals and attempts to determine which function it is currently in. As a result, this has almost no impact on the performance of the running application. However, this approach has its drawbacks.
Let's first try profiling the first program with two libraries.
Typically, to run profiling with this utility, you need to preload the libprofiler.so library, set the sampling frequency, and specify a file to save the dump. Unfortunately, the profiler requires the program to terminate "on its own." Forcing the program to terminate will result in the dump report simply not being created. This is inconvenient when profiling long-running programs that don't terminate on their own, such as daemons. To circumvent this, I created the following script:
gprof.sh
This utility must be run by passing the executable file name and a list of its parameters as parameters. It is also assumed that the necessary files, libprofiler.so and pprof, are located alongside the script. If the program is long-running and terminates by interrupting execution, the N_STOP variable must be set to true, for example:
N_STOP=true ./gprof.sh ./test_profiler 10000000000
At the end of the run, the script will generate a report in my favorite callgrind format.
So, let's run our program under this profiler.
./gprof.sh ./test_profiler 1000000000
In principle, it's all quite clear.
As I already said, Google's profiler works by stopping program execution and evaluating the current function. How does it do this? It does it by unwinding the stack. But what if, while unwinding the stack, the program itself was unwinding the stack? Well, obviously, nothing good will happen. Let's check this. Let's write the following function:
int runExcept(int res) {
if (res % 13 == 0) {
throw std::string("Exception");
}
return res;
}
int func(int arg) {
int fst = 1;
int snd = 1;
for (int i = 0; i < arg; i++) {
int res = (fst + snd + 1) % 19845689;
try {
res = runExcept(res);
} catch (const std::string &e) {
res = res - 1;
}
fst = snd;
snd = res;
}
return fst;
}
Let's run profiling. The program will freeze fairly quickly.
There's another problem related to how the profiler works. Let's say we've managed to unwind the stack, and now we need to map addresses to specific program functions. This can be quite challenging, since quite a few functions are inlined in C++. Let's look at this example:
#include "func.h"
static int func1(int arg) {
std::cout << 1 << std::endl;
return func(arg);
}
static int func2(int arg) {
std::cout << 2 << std::endl;
return func(arg);
}
static int func3(int arg) {
std::cout << 3 << std::endl;
if (arg % 2 == 0) {
return func2(arg);
} else {
return func1(arg);
}
}
int main(int argc, char **argv) {
if (argc != 2) {
std::cout << "Incorrect args";
return -1;
}
const int arg = std::atoi(argv[1]);
int arg2 = func3(arg);
int arg3 = func(arg);
std::cout << "result: " << arg2 + arg3;
return 0;
}
It is obvious that if you run the program like this:
./gprof.sh ./test_profiler 1000000000
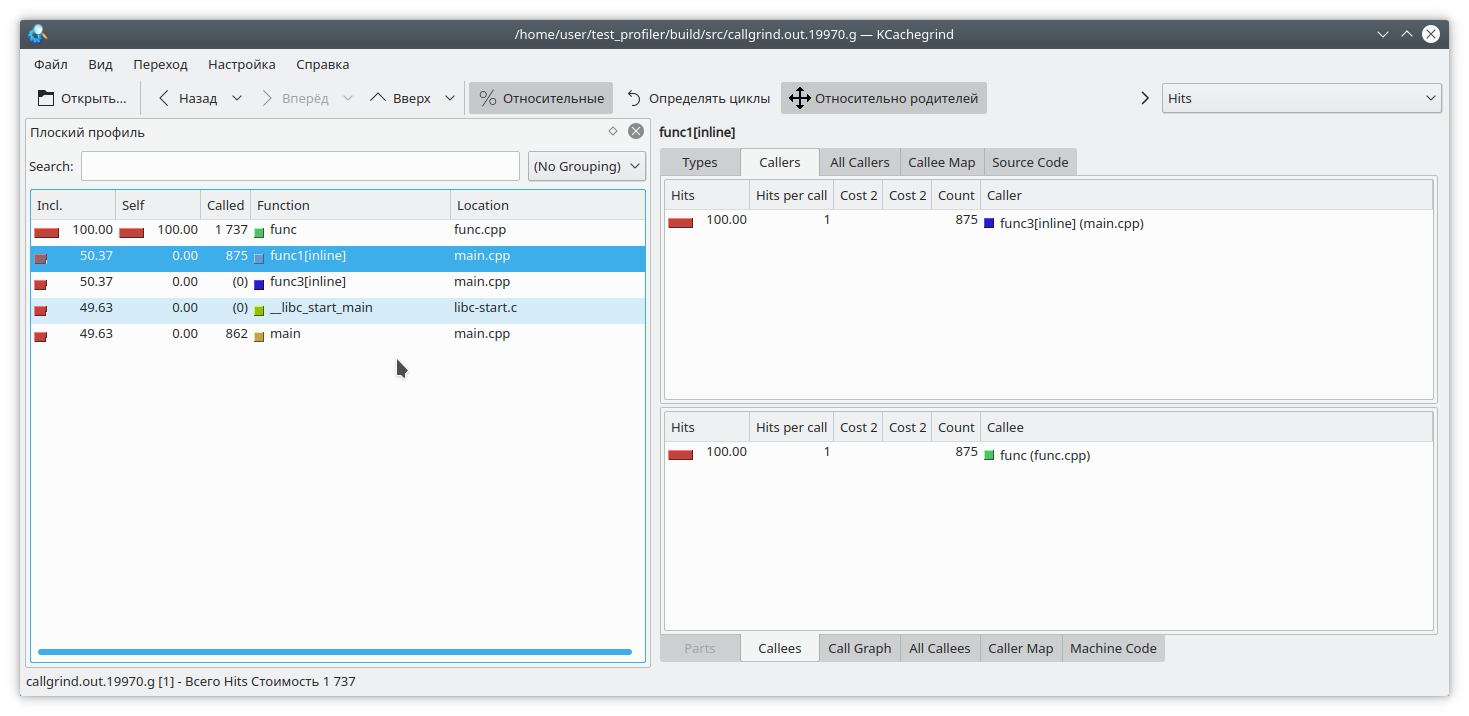
then func1 will never be called. But the profiler thinks otherwise: (By the way, valgrind decided to remain discreet here and not specify which specific function the call came from.)
Situations often arise where an application's memory "leaks." If this is due to a lack of resource cleanup, Memcheck should help identify the problem. But in modern C++, it's not that difficult to avoid manual resource management. unique_ptr, shared_ptr, vector, and map make manipulating "naked" pointers pointless.
Nevertheless, even in such applications, memory leaks do occur. How does this happen? Quite simply, typically it's something like "put a value into a long-lived map and then forget to delete it." Let's try to track this situation down.
To do so, we'll rewrite our test function as follows.
#include "func.h"
#include <deque>
#include <string>
#include <map>
static std::deque<std::string> deque;
static std::map<int, std::string> map;
int func(int arg) {
int fst = 1;
int snd = 1;
for (int i = 0; i < arg; i++) {
int res = (fst + snd + 1) % 19845689;
fst = snd;
snd = res;
deque.emplace_back(std::to_string(res) + " integer");
map = "integer " + std::to_string(res);
deque.pop_front();
if (res % 200 != 0) {
map.erase(i - 1);
}
}
return fst;
}
Here, we add some elements to the map at each iteration, and sometimes, quite by accident (really?), we forget to remove them. We also slightly torture std::deque to throw off attention.
We'll use two tools to catch memory leaks: valgrind massif and google heapdump .
We launch the program with this command
valgrind --tool=massif ./test_profiler 1000000
And we see something like this
Massive
It's clear that massif was able to detect a leak in the function, but it's not yet clear where. Let's recompile the program with the -fno-inline flag and run the analysis again.
massive
Now it's clear where the leak is—in the map element insertion. Massif can detect short-lived objects, so the std::deque manipulations are invisible in this dump.
For Google Heapdump to work, you need to link or preload the tcmalloc library . This library replaces the standard memory allocation functions malloc, free, and so on. It can also collect information about the usage of these functions, which we'll use when analyzing the program.
Since this method is very slow (even compared to massif), I recommend disabling function inlining immediately during compilation with the -fno-inline option . So, let's rebuild our application and run it with the command
HEAPPROFILESIGNAL=23 HEAPPROFILE=./heap ./test_profiler 100000000
This assumes that the tcmalloc library is linked to our application.
Now, we wait for a certain amount of time, until a noticeable leak occurs, and then send signal 23 to our process.
kill -23 <pid>
The result is a file named heap.0001.heap, which we convert to callgrind format using the command
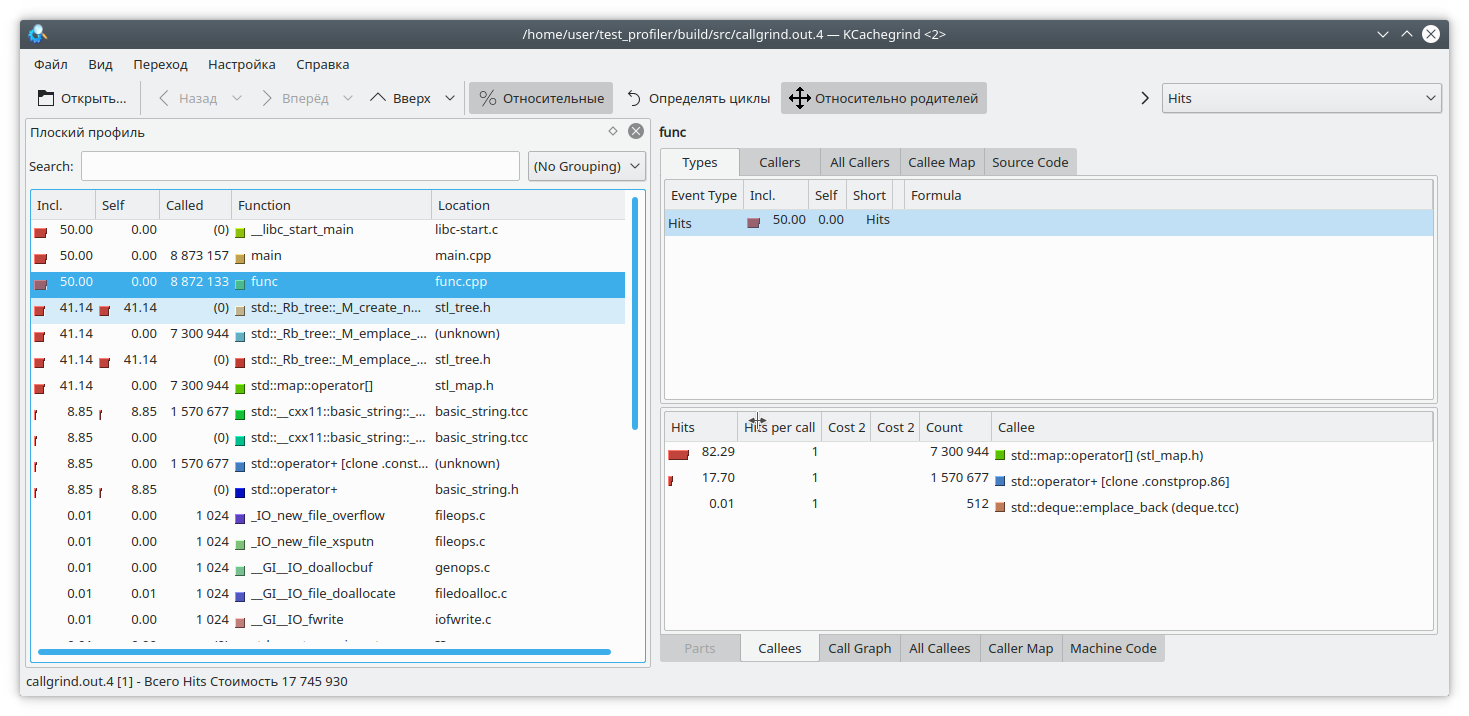
pprof ./test_profiler "./heap.0001.heap" --inuse_space --callgrind > callgrind.out.4
Also pay attention to pprof's options. You can choose from inuse_space , inuse_objects , alloc_space , and alloc_objects , which show the space or objects currently in use, or the space and objects allocated over the entire program's lifetime, respectively. We're interested in the inuse_space option, which shows the currently used memory space.
Opening our beloved kCacheGrind, we see that std::map has "eaten" too much memory. There's probably a leak there.
Profiling in C++ is a very challenging task. We have to contend with function inlining, unsupported instructions, incorrect results, and so on. You can't always trust the profiler's results.
In addition to the functions suggested above, there are other profiling tools, such as perf, Intel VTune, and others. However, they also exhibit some of the aforementioned shortcomings. Therefore, don't forget about the traditional profiling method of measuring function execution time and logging it.
Also, if you have any interesting code profiling techniques, please share them in the comments.
This article will cover the specifics of program profiling using valgrind and Google perftools . This material is not very structured; it's more of an attempt to compile a knowledge base "for personal use" so that in the future you won't have to frantically remember "why this isn't working" or "how to do that." It's likely that not all non-obvious cases will be covered here; if you have anything to add, please leave a comment.
All examples will be run on a Linux system.
Runtime profiling
Preparation
To analyze the profiling features, I will run small programs, typically consisting of one main.cpp file and one func.cpp file with an include.
I will compile them with the g++ 8.3.0 compiler .
Since profiling unoptimized programs is a rather strange undertaking, we will compile with the -Ofast option , and to get debug symbols in the output, we will not forget to add the -g option . However, sometimes instead of normal function names, you can see only obscure call addresses. This means that "address space layout randomization" has occurred. This can be determined by calling the nm command on the binary. If most addresses look something like 000000000000030e0 (a large number of leading zeros), then this is most likely it. In a normal program, addresses look like 0000000000402fa0. Therefore, you need to add the -no-pie option . As a result, the full set of options will look like this:
-Ofast -g -no-pie
To view the results, we will use the KCachegrind program , which can work with the callgrind report format.
Callgrind
The first utility we'll look at today is callgrind . This utility is part of the valgrind tool. It emulates every executable instruction in a program and, based on internal metrics about the "cost" of each instruction, produces the desired conclusion. Because of this approach, callgrind sometimes fails to recognize the next instruction and fails with the error "
Unrecognized instruction at address.
" The only solution to this problem is to review all compilation options and try to find the interfering one.
To test this tool, let's create a program consisting of one shared and one static library (we'll discard these libraries in other tests). Each library, as well as the program itself, will provide a simple computational function, for example, calculating the Fibonacci sequence.
static_lib
shared_lib
main
We compile the program and run valgrind as follows:
valgrind --tool=callgrind ./test_profiler 100000000

We see that the result for the static library and the regular function is similar to what we expected. However, in the dynamic library, callgrind was unable to fully resolve the function.
To fix this, set the LD_BIND_NOW variable to 1 when starting the program, like this:
LD_BIND_NOW=1 valgrind --tool=callgrind ./test_profiler 100000000

And now, as you can see, everything is fine.
The next problem with callgrind, arising from profiling using instruction emulation, is that program execution slows down significantly. This can lead to incorrect relative estimates of execution time for different parts of the code.
Let's consider the following code:
int func(int arg) {
int fst = 1;
int snd = 1;
std:
fstream file("tmp.txt");for (int i = 0; i < arg; i++) {
int res = (fst + snd + 1) % 19845689;
std::string r = std::to_string(res);
file << res;
file.flush();
fst = snd;
snd = res + r.size();
}
return fst;
}
Here, I've added a small write to a file for each loop iteration. Since writing to a file is a fairly time-consuming operation, I've added a string generation from a number to each loop iteration to counterbalance the cost. Clearly, in this case, writing to the file takes longer than the rest of the function's logic. But callgrind has a different take: It's also worth noting that callgrind can only measure the cost of a function while it's running. If the function isn't running, the cost doesn't increase. This complicates debugging programs that occasionally lock up or interact with a blocking filesystem/network. Let's check:
#include "func.h"
#include <mutex>
static std::mutex mutex;
int funcImpl(int arg) {
std::lock_guard<std::mutex> lock(mutex);
int fst = 1;
int snd = 1;
for (int i = 0; i < arg; i++) {
int res = (fst + snd + 1) % 19845689;
fst = snd;
snd = res;
}
return fst;
}
int func2(int arg){
return funcImpl(arg);
}
int func(int arg) {
return funcImpl(arg);
}
int main(int argc, char **argv) {
if (argc != 2) {
std::cout << "Incorrect args";
return -1;
}
const int arg = std::atoi(argv[1]);
auto future = std::async(std::launch::async, &func2, arg);
std::cout << "result: " << func(arg) << std::endl;
std::cout << "second result " << future.get() << std::endl;
return 0;
}
Here, we've nested the entire function execution within a mutex lock and called this function from two different threads. The callgrind result is quite predictable—it doesn't see a problem with the mutex lock: So, we've covered some of the issues with using the callgrind profiler. Let's move on to the next test subject—the Google perftools profiler.
google perftools
Unlike callgrind, Google's profiler operates differently.
Instead of analyzing every instruction of an executable program, it pauses execution at regular intervals and attempts to determine which function it is currently in. As a result, this has almost no impact on the performance of the running application. However, this approach has its drawbacks.
Let's first try profiling the first program with two libraries.
Typically, to run profiling with this utility, you need to preload the libprofiler.so library, set the sampling frequency, and specify a file to save the dump. Unfortunately, the profiler requires the program to terminate "on its own." Forcing the program to terminate will result in the dump report simply not being created. This is inconvenient when profiling long-running programs that don't terminate on their own, such as daemons. To circumvent this, I created the following script:
gprof.sh
This utility must be run by passing the executable file name and a list of its parameters as parameters. It is also assumed that the necessary files, libprofiler.so and pprof, are located alongside the script. If the program is long-running and terminates by interrupting execution, the N_STOP variable must be set to true, for example:
N_STOP=true ./gprof.sh ./test_profiler 10000000000
At the end of the run, the script will generate a report in my favorite callgrind format.
So, let's run our program under this profiler.
./gprof.sh ./test_profiler 1000000000

In principle, it's all quite clear.
As I already said, Google's profiler works by stopping program execution and evaluating the current function. How does it do this? It does it by unwinding the stack. But what if, while unwinding the stack, the program itself was unwinding the stack? Well, obviously, nothing good will happen. Let's check this. Let's write the following function:
int runExcept(int res) {
if (res % 13 == 0) {
throw std::string("Exception");
}
return res;
}
int func(int arg) {
int fst = 1;
int snd = 1;
for (int i = 0; i < arg; i++) {
int res = (fst + snd + 1) % 19845689;
try {
res = runExcept(res);
} catch (const std::string &e) {
res = res - 1;
}
fst = snd;
snd = res;
}
return fst;
}
Let's run profiling. The program will freeze fairly quickly.
There's another problem related to how the profiler works. Let's say we've managed to unwind the stack, and now we need to map addresses to specific program functions. This can be quite challenging, since quite a few functions are inlined in C++. Let's look at this example:
#include "func.h"
static int func1(int arg) {
std::cout << 1 << std::endl;
return func(arg);
}
static int func2(int arg) {
std::cout << 2 << std::endl;
return func(arg);
}
static int func3(int arg) {
std::cout << 3 << std::endl;
if (arg % 2 == 0) {
return func2(arg);
} else {
return func1(arg);
}
}
int main(int argc, char **argv) {
if (argc != 2) {
std::cout << "Incorrect args";
return -1;
}
const int arg = std::atoi(argv[1]);
int arg2 = func3(arg);
int arg3 = func(arg);
std::cout << "result: " << arg2 + arg3;
return 0;
}
It is obvious that if you run the program like this:
./gprof.sh ./test_profiler 1000000000
then func1 will never be called. But the profiler thinks otherwise: (By the way, valgrind decided to remain discreet here and not specify which specific function the call came from.)

Memory profiling
Situations often arise where an application's memory "leaks." If this is due to a lack of resource cleanup, Memcheck should help identify the problem. But in modern C++, it's not that difficult to avoid manual resource management. unique_ptr, shared_ptr, vector, and map make manipulating "naked" pointers pointless.
Nevertheless, even in such applications, memory leaks do occur. How does this happen? Quite simply, typically it's something like "put a value into a long-lived map and then forget to delete it." Let's try to track this situation down.
To do so, we'll rewrite our test function as follows.
#include "func.h"
#include <deque>
#include <string>
#include <map>
static std::deque<std::string> deque;
static std::map<int, std::string> map;
int func(int arg) {
int fst = 1;
int snd = 1;
for (int i = 0; i < arg; i++) {
int res = (fst + snd + 1) % 19845689;
fst = snd;
snd = res;
deque.emplace_back(std::to_string(res) + " integer");
map = "integer " + std::to_string(res);
deque.pop_front();
if (res % 200 != 0) {
map.erase(i - 1);
}
}
return fst;
}
Here, we add some elements to the map at each iteration, and sometimes, quite by accident (really?), we forget to remove them. We also slightly torture std::deque to throw off attention.
We'll use two tools to catch memory leaks: valgrind massif and google heapdump .
Massive
We launch the program with this command
valgrind --tool=massif ./test_profiler 1000000
And we see something like this
Massive
It's clear that massif was able to detect a leak in the function, but it's not yet clear where. Let's recompile the program with the -fno-inline flag and run the analysis again.
massive
Now it's clear where the leak is—in the map element insertion. Massif can detect short-lived objects, so the std::deque manipulations are invisible in this dump.
Heapdump
For Google Heapdump to work, you need to link or preload the tcmalloc library . This library replaces the standard memory allocation functions malloc, free, and so on. It can also collect information about the usage of these functions, which we'll use when analyzing the program.
Since this method is very slow (even compared to massif), I recommend disabling function inlining immediately during compilation with the -fno-inline option . So, let's rebuild our application and run it with the command
HEAPPROFILESIGNAL=23 HEAPPROFILE=./heap ./test_profiler 100000000
This assumes that the tcmalloc library is linked to our application.
Now, we wait for a certain amount of time, until a noticeable leak occurs, and then send signal 23 to our process.
kill -23 <pid>
The result is a file named heap.0001.heap, which we convert to callgrind format using the command
pprof ./test_profiler "./heap.0001.heap" --inuse_space --callgrind > callgrind.out.4
Also pay attention to pprof's options. You can choose from inuse_space , inuse_objects , alloc_space , and alloc_objects , which show the space or objects currently in use, or the space and objects allocated over the entire program's lifetime, respectively. We're interested in the inuse_space option, which shows the currently used memory space.
Opening our beloved kCacheGrind, we see that std::map has "eaten" too much memory. There's probably a leak there.

Conclusions
Profiling in C++ is a very challenging task. We have to contend with function inlining, unsupported instructions, incorrect results, and so on. You can't always trust the profiler's results.
In addition to the functions suggested above, there are other profiling tools, such as perf, Intel VTune, and others. However, they also exhibit some of the aforementioned shortcomings. Therefore, don't forget about the traditional profiling method of measuring function execution time and logging it.
Also, if you have any interesting code profiling techniques, please share them in the comments.