


Hi everyone, my name is Vadim Mezentsev, and I'm an Android developer on the Yandex Go team. Today, I'd like to share the story of how we searched for an approach to profiling our app, the challenges we encountered, and how we ultimately implemented a performance measurement library.
Our team often encountered problems finding performance bottlenecks in our app. We tried various profiling tools, but they all took too much time to collect metrics, analyze, and filter the required data. To solve this problem, we developed our own solution that combines speed of analysis with ease of problem detection. We created the Demeter library , which is easy to integrate into the debug version of an Android app. It allows you to obtain performance reports during app use and screen transitions. This build can be passed on to the testing team, who can then analyze the reports and examine any changes.
To measure performance, let's go back to the basics: Google suggests we break down all existing performance issues into three parts: Slow Frames, Frozen Frames, and ANRs.

Excerpt from Android documentation. Source
Slow Frames encounter issues starting at 16 ms because they're tied to the rendering time of a single frame. For example, to ensure 60 FPS (60 frames per second), the rendering time of a single frame must be no more than 11 ms. Anything higher is a problem. For 90 and 120 FPS, we must ensure even shorter execution times for each function. We'll be focusing on these areas and fixing them.
Ideally, we need to not only develop a process for identifying performance issues, but also automate it: figure out how to launch a study, organize data collection, generate reports, and then use our tools for more accurate analysis.
First, we need to look at what tools others are using. For automation, this includes Firebase Performance Metrics and a combination of Pulse and PerfTests (we also use these and supplement them with custom metrics). In terms of tools, we'll look at Profiler, Perfecto, and YAMP—they belong to the same family and help analyze stack traces—as well as our own Demeter library.

Firebase Performance Monitoring
Firebase automatically collects all the basic metrics, but if you're still missing something, you can add your own, and they'll automatically be integrated into the web interface. This way, you'll have a wealth of information about the devices your users are using, allowing you to build further hypotheses based on this data.
PerfTests is a tool we use internally at Yandex. It allows us to run instrumented tests in an isolated environment. These tests are run regularly in a closed loop and can be repeated a specified number of times. Pulse serves as the interface for displaying PerfTests results.

PerfTests are convenient because we can figure out where exactly the problem is hiding, run Bisect, find the relevant commit, and fix it. But because writing PerfTests is difficult, it creates a lot of false positives and, consequently, tasks. It takes a lot of time to sort them out.
Although tests automatically detect anomalies and the PR (Pull Request) author, the team must regularly allocate time to investigate these incidents. Furthermore, writing tests is quite challenging: each one must be isolated, all network responses must be saved, and the tests must be maintained while new functionality is being developed. Overall, it's a lot of work.
Next, we'll look at how to collect Custom Metrics (your own metrics) through AppMetrica and analyze them yourself.

To display data, we use DataLens , which collects various application events, including performance-related events. To collect this information, we can measure the execution time at the beginning of a function and send the execution time data to AppMetrica at the end.
For example, for measurements, we send the parameter timeSinceAppLaunch. This specifies the time since the app launched and the duration ( duration) to display the time of this event. This allows us to clearly understand when we started the measurement and how long it lasted.
This way, we can gather information about how a specific feature works for different users, as well as learn details about their environment and how the method works on real devices. Based on this data, we can develop hypotheses and make decisions to address performance issues. However, it's important to keep in mind that this data is delayed, as app updates don't reach users immediately, meaning events appear later than we'd like.

Changes in the speed of functionality execution over time. X is the application version, Y is the running time.
The advantages of manually adding events are that we can easily add new metrics, control what we're measuring, and gain a wealth of additional information about the environment. The disadvantage is that the team must invest time in regularly updating their code with new metrics and monitoring their reliability.
For this, we can use Android Profiler or Perfetto , which allow us to analyze the stacktrace and examine what's happening in detail. These tools help identify delays, visualize problem areas, and pinpoint the exact step where something is going wrong.

Analyzing the call stack in Android Profiler
There's also the YAMP tool . It's a modified Profiler, and it's also used by mobile developers across various Yandex teams. It's convenient because it allows you to filter, highlight, and modify all events.

Both tools share one problem: they don't allow you to view all possible methods. For example, to add a method to Profiler for analysis, you need to manually write the code, open the section, specify the method, close it, and recompile—and only then will the data become available. This isn't always convenient.

So, we have a whole "zoo" of useful tools, but using them requires a lot of effort in analysis or waiting for the data to be ready. But we want to reduce this time and simplify the process of finding problems in the code.
At the same time, we don't want to abandon existing tools: our goal is to complement and accelerate research. This is how the idea came about: creating a library that would automatically display method execution times during application execution, add profiler information for a more detailed stacktrace, and display dependency initialization times for Dagger and the number of recompositions for Compose.
Let's look at some abstract function heavyOperation. How can we tell if it's the one taking a long time to load?

Now let's replace logging with a call to a separate function, for example TraceMetricsHolder.log, to collect information in one place.


But this approach is inconvenient and labor-intensive, so we automated the process (more on that below). The result is a system that analyzes all injected objects, recording method execution times, class creation times, and the execution threads they run in. The data can also be exported to CSV format for easy loading into the tracker and comparing with previous results.
We were interested in analyzing the construction time of Dagger dependencies, so we wrote an analyzer that works with @Inject annotations.

Measuring the initialization time of Inject objects
To fully understand what's happening inside the application, we covered all methods, including those of linked libraries, with monitoring. This allowed us to track which operations were being executed at any given moment.
This proved especially useful in our Yandex Go app, which uses multiple SDKs. We immediately saw if a new library was slowing things down and could quickly figure out the cause. We also quickly identified slow methods used by our colleagues, created tasks, and promptly fixed them.

Investigating all application calls
We also developed a small Compose analyzer to track the frequency of recompositions and identify what caused these recompositions.

Compose analyzer
To achieve this automation, we used two approaches: one based on the ASM Visitor Factory, and the other on the Kotlin Compiler Plugin.

Before you start writing an ASM Class Visitor, it's important to understand the general application build process: how source code is turned into an executable file.
ASM transforms the code after it's packaged into a .dex file, meaning all linked libraries, including third-party ones, will already be in the .dex files, allowing us to influence them and modify the code. In our case, we'll be able to analyze it.

Our goal is to add a special method call to all application methods to measure their execution time. For this purpose, ASM allows us to override [method] ClassVisitor, where we create our own visitor and specify which packages we will work with, which methods to override, and what logic to apply.
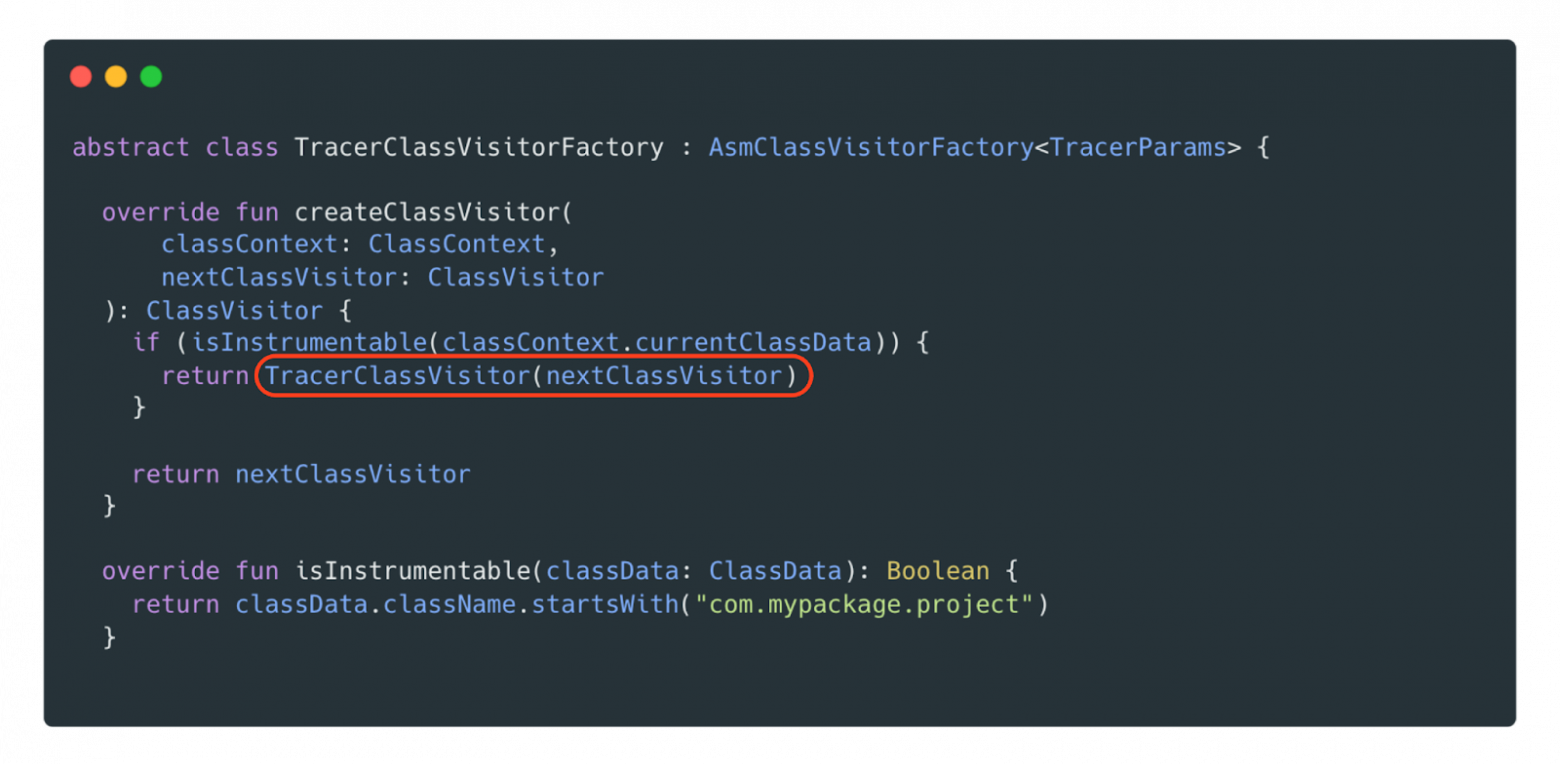
The overridden method isInstrumentabledefines the locations our Visitor will access, and in this case, we've specified the package com.mypackage.project. If the method isInstrumentablereturns true, it means we'll analyze absolutely all the code in our application, including all linked libraries. Since we only need to override methods, we'll take the visitMethod method from Class Visitor and use the helper class AdviceAdapter .
We override [ visitMethod] using AdviceAdapter . In this case, we're creating a new implementation ExampleMethodAdapterinheriting from AdviceAdapter . This allows us to use a higher level of abstraction, avoiding the need to delve too deeply into the work Opcodesand relying on ready-made implementations.

From AdviceAdapter, we'll override two methods: onMethodEnterand onMethodExit. In onMethodEnter, we need to call a method to measure the current time and save the result. However, unlike in Kotlin and Java, here we can't simply save the value to a variable. We need to determine the offset on the stack where it will be written. For this, AdviceAdapterthe method provides a method newLocalthat automatically finds the appropriate offset and reserves the necessary space in local variables.
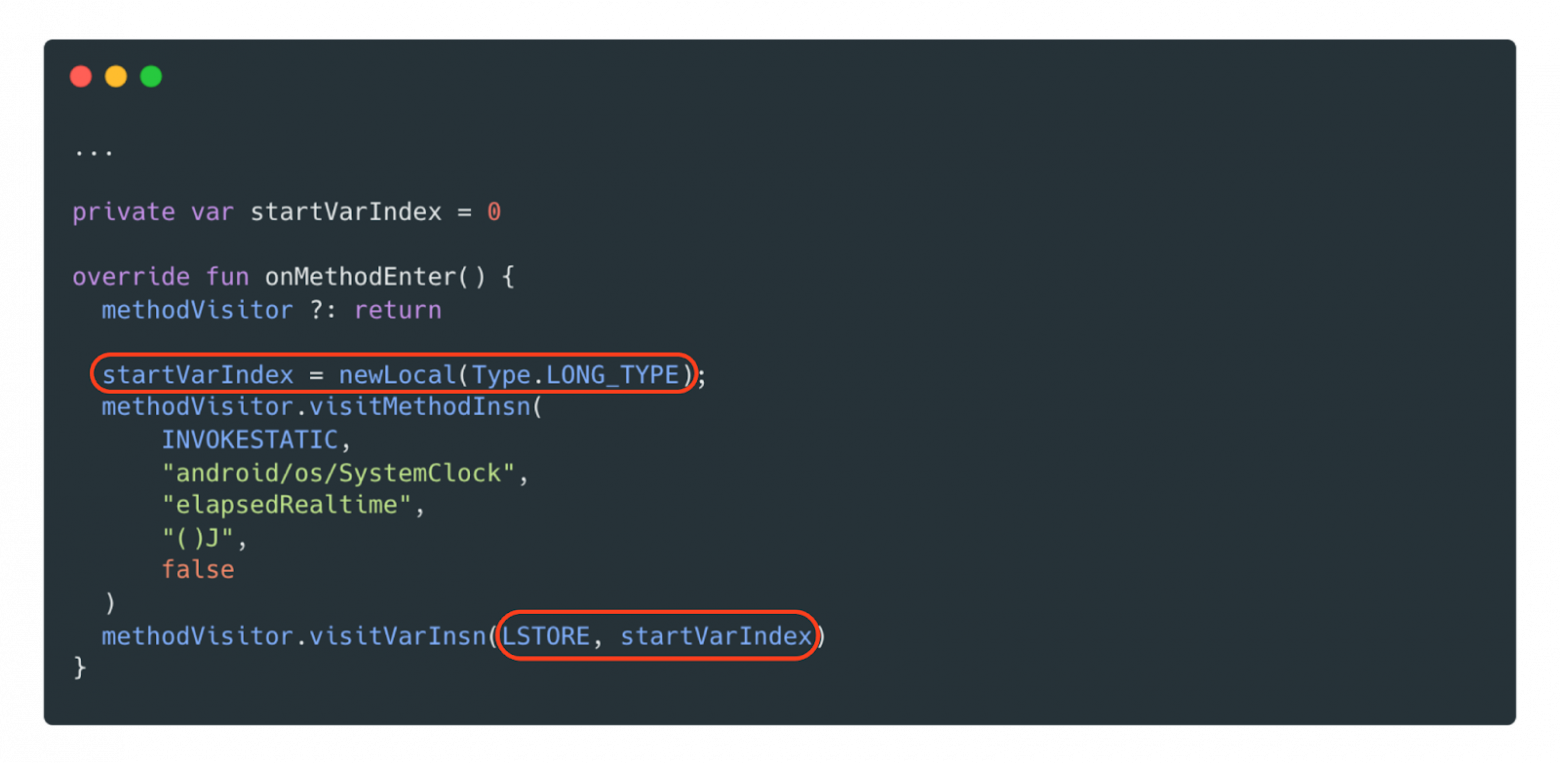
After this, we need to save the variable using Opcode LSTORE the offset. The called method SystemClock.elapsedRealtimewill write the current time to this variable, and then we'll read this variable upon exiting the function.
We onMethodExit're only interested in Opcode RETURN, so we'll limit ourselves to it and retrieve the data from the previously saved variable via LLOAD. All that's left is to call the static function TraceMetricsHolder, passing in the measurement start value.

Now we just need to configure the Gradle plugin so that it runs during compilation after packaging.dex. Here, we simply need to specify our Visitor Class and the scope where we will examine and transform our code. For example, if we specify all, this means we will transform all included libraries. However, you can limit this to just your project by specifying PROJECT.


The second approach we used was the Kotlin Compiler Plugin. Returning to the same code transformation scheme, it's worth noting that it works specifically on transforming source code. This means it can't interact with linked libraries. Let's see how this works using the example of investigating Compose recompositions in Demeter.

Diagram of the frontend and backend parts of the Kotlin Compiler Plugin
The frontend of the Kotlin Compiler Plugin is responsible for constructing the syntax tree and analyzing the source code, but that's not important in my example. I'm interested in code generation and modification, so I'll be working with the backend, specifically the JVM.
Let's say we have a simple @Composable function responsible for text input. To measure the number of recompositions, let's look at how this function is translated into Java code.
Original function:

How the compiler converts the Compose function into Java code:

As you can see, the generated code has become more verbose. To determine when a function begins recomposing, we need to find and log the method updateScope. To do this, we need to add logging immediately after calling updateScope, and for this we'll need the Kotlin Compiler Plugin, specifically transform with an override visitCall.
Let's add our method notifyRecompositionafter updateScope:

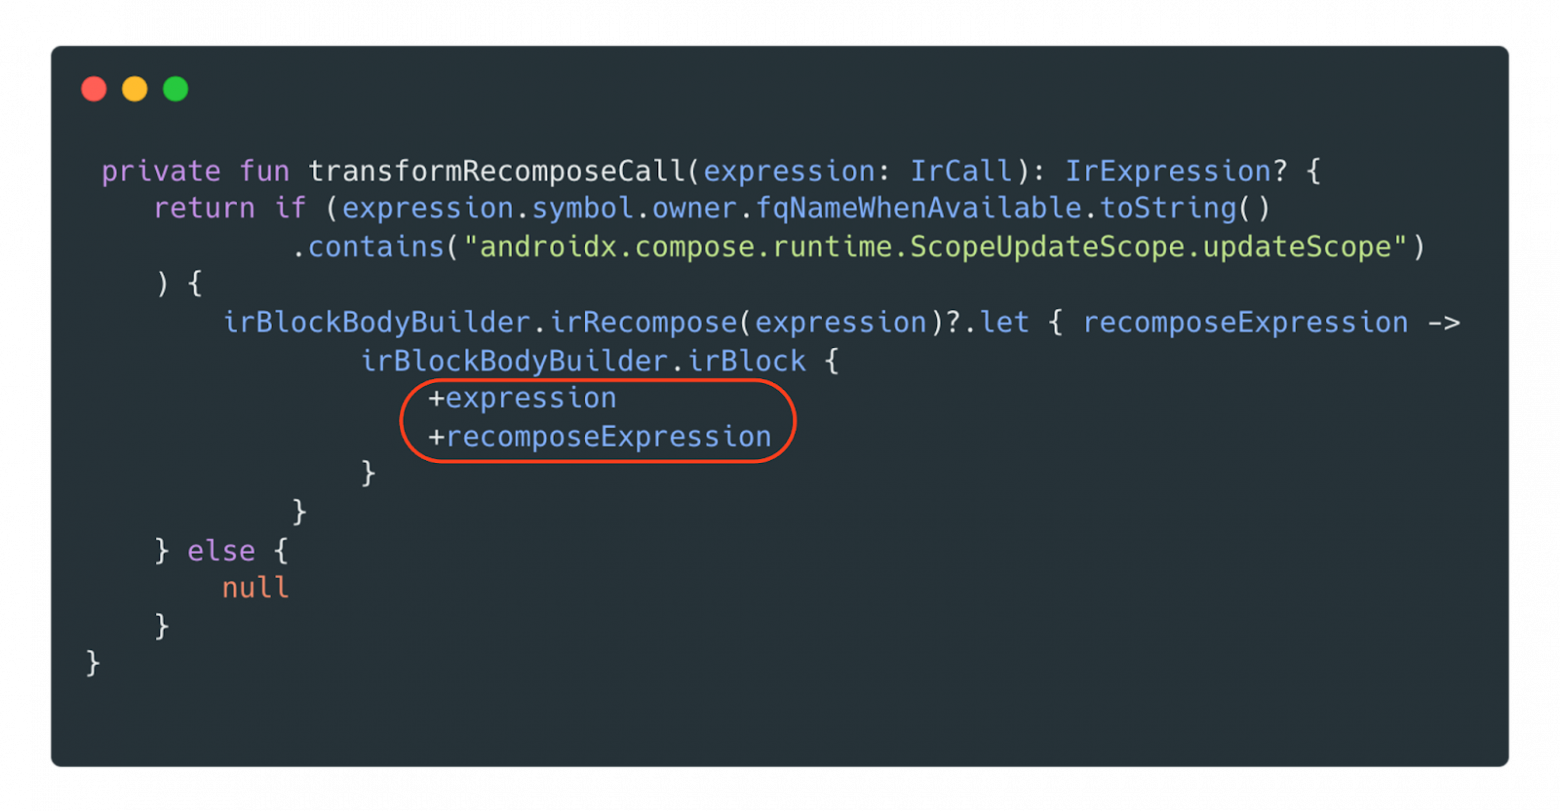
To do this, let's create a Transformer by inheriting from IrElemetTransformerVoidWithContextthe Kotlin Compiler Plugin class and overriding the method visitCall. Find the call to it updateScopeand try to transform it right away—in the code, it's transformRecomposeCall.

transformRecomposeCallSearches for the target function by name and uses [] irBlockBodyBuilderto add the necessary logging call. Don't forget to add it to visitCallthe current function, otherwise it will be lost and simply "cut out."

irRecompose — extension function for transformation, which we will consider below.

If the transformation was successful, then you first need to add the “modified” function, and then your method.
To add our callback to the project, we need to extract our function from the current context—in this case, notifyRecomposition from Demeter. We're sure this method exists, so we call it without any additional checks. This gives us a callable to work with.

Let's return to the implementation of the irRecompose extension function. Since the function being analyzed must be @Composable, its first argument must be composer. If this argument is present, great—we can modify the code and add the function we need.

We create a new call, which we add to the existing function RecomposeNotifyFunctionand pass it the required argument.

So, our project uses two approaches: ASM and the Kotlin Compiler Plugin. Their pros and cons:

We also used two approaches because developers aren't usually thrilled when they see ASM code: few are eager to work with it. However, the convenient and user-friendly Kotlin Compiler Plugin makes working with it much more enjoyable. It allows us to make the necessary changes without unnecessary complications, and we don't always have to delve into third-party libraries.
Simply build the project, and the build can be handed over to QA. They can test the required screens, record measurements, and then export the data to the developers. This will help them understand how long the code took to run on different devices and what happened during the process.
Furthermore, we'll be able to identify performance dips as early as the pull request stage, without waiting for it to go into production. Demeter can also be used to analyze third-party libraries. To achieve this, we've developed a functionality extension system that makes it easy to add new plugins, significantly simplifying the developer experience.
Our team often encountered problems finding performance bottlenecks in our app. We tried various profiling tools, but they all took too much time to collect metrics, analyze, and filter the required data. To solve this problem, we developed our own solution that combines speed of analysis with ease of problem detection. We created the Demeter library , which is easy to integrate into the debug version of an Android app. It allows you to obtain performance reports during app use and screen transitions. This build can be passed on to the testing team, who can then analyze the reports and examine any changes.
Why measure performance?
So, the first thing we need to do is define the purpose for which we want to measure something. In our case, when a user opens Yandex Go, they need to quickly place an order, get in the car, and go. A long loading screen is a waste of time for the user, who may have their plans disrupted and end up using another app. This is a loss for both the user and the business—we definitely don't need that.To measure performance, let's go back to the basics: Google suggests we break down all existing performance issues into three parts: Slow Frames, Frozen Frames, and ANRs.
Excerpt from Android documentation. Source
Slow Frames encounter issues starting at 16 ms because they're tied to the rendering time of a single frame. For example, to ensure 60 FPS (60 frames per second), the rendering time of a single frame must be no more than 11 ms. Anything higher is a problem. For 90 and 120 FPS, we must ensure even shorter execution times for each function. We'll be focusing on these areas and fixing them.
Ideally, we need to not only develop a process for identifying performance issues, but also automate it: figure out how to launch a study, organize data collection, generate reports, and then use our tools for more accurate analysis.
First, we need to look at what tools others are using. For automation, this includes Firebase Performance Metrics and a combination of Pulse and PerfTests (we also use these and supplement them with custom metrics). In terms of tools, we'll look at Profiler, Perfecto, and YAMP—they belong to the same family and help analyze stack traces—as well as our own Demeter library.
Performance measurement tools
Firebase . This tool automatically measures app startup time—you can simply connect the library and get ready-made reports for both foreground and background. Firebase provides data on Slow and Frozen Frames, allowing you to classify them into groups and visualize the percentage of issues, including ANRs, on graphs in the report.
Firebase Performance Monitoring
Firebase automatically collects all the basic metrics, but if you're still missing something, you can add your own, and they'll automatically be integrated into the web interface. This way, you'll have a wealth of information about the devices your users are using, allowing you to build further hypotheses based on this data.
PerfTests is a tool we use internally at Yandex. It allows us to run instrumented tests in an isolated environment. These tests are run regularly in a closed loop and can be repeated a specified number of times. Pulse serves as the interface for displaying PerfTests results.
PerfTests are convenient because we can figure out where exactly the problem is hiding, run Bisect, find the relevant commit, and fix it. But because writing PerfTests is difficult, it creates a lot of false positives and, consequently, tasks. It takes a lot of time to sort them out.
Although tests automatically detect anomalies and the PR (Pull Request) author, the team must regularly allocate time to investigate these incidents. Furthermore, writing tests is quite challenging: each one must be isolated, all network responses must be saved, and the tests must be maintained while new functionality is being developed. Overall, it's a lot of work.
Next, we'll look at how to collect Custom Metrics (your own metrics) through AppMetrica and analyze them yourself.
To display data, we use DataLens , which collects various application events, including performance-related events. To collect this information, we can measure the execution time at the beginning of a function and send the execution time data to AppMetrica at the end.
For example, for measurements, we send the parameter timeSinceAppLaunch. This specifies the time since the app launched and the duration ( duration) to display the time of this event. This allows us to clearly understand when we started the measurement and how long it lasted.
This way, we can gather information about how a specific feature works for different users, as well as learn details about their environment and how the method works on real devices. Based on this data, we can develop hypotheses and make decisions to address performance issues. However, it's important to keep in mind that this data is delayed, as app updates don't reach users immediately, meaning events appear later than we'd like.
Changes in the speed of functionality execution over time. X is the application version, Y is the running time.
The advantages of manually adding events are that we can easily add new metrics, control what we're measuring, and gain a wealth of additional information about the environment. The disadvantage is that the team must invest time in regularly updating their code with new metrics and monitoring their reliability.
What problems can arise with performance measurement?
So, we have various tools for collecting reports. Now it's important to identify where exactly problems are occurring and how they can be resolved.For this, we can use Android Profiler or Perfetto , which allow us to analyze the stacktrace and examine what's happening in detail. These tools help identify delays, visualize problem areas, and pinpoint the exact step where something is going wrong.
Analyzing the call stack in Android Profiler
There's also the YAMP tool . It's a modified Profiler, and it's also used by mobile developers across various Yandex teams. It's convenient because it allows you to filter, highlight, and modify all events.
Both tools share one problem: they don't allow you to view all possible methods. For example, to add a method to Profiler for analysis, you need to manually write the code, open the section, specify the method, close it, and recompile—and only then will the data become available. This isn't always convenient.
So, we have a whole "zoo" of useful tools, but using them requires a lot of effort in analysis or waiting for the data to be ready. But we want to reduce this time and simplify the process of finding problems in the code.
At the same time, we don't want to abandon existing tools: our goal is to complement and accelerate research. This is how the idea came about: creating a library that would automatically display method execution times during application execution, add profiler information for a more detailed stacktrace, and display dependency initialization times for Dagger and the number of recompositions for Compose.
How We Made Demeter
We want to understand why a particular function is taking a long time to execute. We want to see what's causing the long load times, which function is taking a long time, and, most importantly, be able to see these functions all in one place. That's why we started building Demeter.Let's look at some abstract function heavyOperation. How can we tell if it's the one taking a long time to load?
Now let's replace logging with a call to a separate function, for example TraceMetricsHolder.log, to collect information in one place.
But this approach is inconvenient and labor-intensive, so we automated the process (more on that below). The result is a system that analyzes all injected objects, recording method execution times, class creation times, and the execution threads they run in. The data can also be exported to CSV format for easy loading into the tracker and comparing with previous results.
We were interested in analyzing the construction time of Dagger dependencies, so we wrote an analyzer that works with @Inject annotations.
Measuring the initialization time of Inject objects
To fully understand what's happening inside the application, we covered all methods, including those of linked libraries, with monitoring. This allowed us to track which operations were being executed at any given moment.
This proved especially useful in our Yandex Go app, which uses multiple SDKs. We immediately saw if a new library was slowing things down and could quickly figure out the cause. We also quickly identified slow methods used by our colleagues, created tasks, and promptly fixed them.
Investigating all application calls
We also developed a small Compose analyzer to track the frequency of recompositions and identify what caused these recompositions.
Compose analyzer
To achieve this automation, we used two approaches: one based on the ASM Visitor Factory, and the other on the Kotlin Compiler Plugin.
ASM Visitor Factory
Before you start writing an ASM Class Visitor, it's important to understand the general application build process: how source code is turned into an executable file.
ASM transforms the code after it's packaged into a .dex file, meaning all linked libraries, including third-party ones, will already be in the .dex files, allowing us to influence them and modify the code. In our case, we'll be able to analyze it.
Our goal is to add a special method call to all application methods to measure their execution time. For this purpose, ASM allows us to override [method] ClassVisitor, where we create our own visitor and specify which packages we will work with, which methods to override, and what logic to apply.
The overridden method isInstrumentabledefines the locations our Visitor will access, and in this case, we've specified the package com.mypackage.project. If the method isInstrumentablereturns true, it means we'll analyze absolutely all the code in our application, including all linked libraries. Since we only need to override methods, we'll take the visitMethod method from Class Visitor and use the helper class AdviceAdapter .
We override [ visitMethod] using AdviceAdapter . In this case, we're creating a new implementation ExampleMethodAdapterinheriting from AdviceAdapter . This allows us to use a higher level of abstraction, avoiding the need to delve too deeply into the work Opcodesand relying on ready-made implementations.
From AdviceAdapter, we'll override two methods: onMethodEnterand onMethodExit. In onMethodEnter, we need to call a method to measure the current time and save the result. However, unlike in Kotlin and Java, here we can't simply save the value to a variable. We need to determine the offset on the stack where it will be written. For this, AdviceAdapterthe method provides a method newLocalthat automatically finds the appropriate offset and reserves the necessary space in local variables.
After this, we need to save the variable using Opcode LSTORE the offset. The called method SystemClock.elapsedRealtimewill write the current time to this variable, and then we'll read this variable upon exiting the function.
We onMethodExit're only interested in Opcode RETURN, so we'll limit ourselves to it and retrieve the data from the previously saved variable via LLOAD. All that's left is to call the static function TraceMetricsHolder, passing in the measurement start value.
Now we just need to configure the Gradle plugin so that it runs during compilation after packaging.dex. Here, we simply need to specify our Visitor Class and the scope where we will examine and transform our code. For example, if we specify all, this means we will transform all included libraries. However, you can limit this to just your project by specifying PROJECT.
Kotlin Compiler Plugin
The second approach we used was the Kotlin Compiler Plugin. Returning to the same code transformation scheme, it's worth noting that it works specifically on transforming source code. This means it can't interact with linked libraries. Let's see how this works using the example of investigating Compose recompositions in Demeter.
Diagram of the frontend and backend parts of the Kotlin Compiler Plugin
The frontend of the Kotlin Compiler Plugin is responsible for constructing the syntax tree and analyzing the source code, but that's not important in my example. I'm interested in code generation and modification, so I'll be working with the backend, specifically the JVM.
Let's say we have a simple @Composable function responsible for text input. To measure the number of recompositions, let's look at how this function is translated into Java code.
Original function:
How the compiler converts the Compose function into Java code:
As you can see, the generated code has become more verbose. To determine when a function begins recomposing, we need to find and log the method updateScope. To do this, we need to add logging immediately after calling updateScope, and for this we'll need the Kotlin Compiler Plugin, specifically transform with an override visitCall.
Let's add our method notifyRecompositionafter updateScope:
To do this, let's create a Transformer by inheriting from IrElemetTransformerVoidWithContextthe Kotlin Compiler Plugin class and overriding the method visitCall. Find the call to it updateScopeand try to transform it right away—in the code, it's transformRecomposeCall.
transformRecomposeCallSearches for the target function by name and uses [] irBlockBodyBuilderto add the necessary logging call. Don't forget to add it to visitCallthe current function, otherwise it will be lost and simply "cut out."
irRecompose — extension function for transformation, which we will consider below.
If the transformation was successful, then you first need to add the “modified” function, and then your method.
To add our callback to the project, we need to extract our function from the current context—in this case, notifyRecomposition from Demeter. We're sure this method exists, so we call it without any additional checks. This gives us a callable to work with.
Let's return to the implementation of the irRecompose extension function. Since the function being analyzed must be @Composable, its first argument must be composer. If this argument is present, great—we can modify the code and add the function we need.
We create a new call, which we add to the existing function RecomposeNotifyFunctionand pass it the required argument.
So, our project uses two approaches: ASM and the Kotlin Compiler Plugin. Their pros and cons:
We also used two approaches because developers aren't usually thrilled when they see ASM code: few are eager to work with it. However, the convenient and user-friendly Kotlin Compiler Plugin makes working with it much more enjoyable. It allows us to make the necessary changes without unnecessary complications, and we don't always have to delve into third-party libraries.
Conclusion
We were looking for a way to speed up the detection of code bottlenecks. Existing tools are quite good, but they don't allow us to quickly identify weak points. So we wrote our own tool that allows us to quickly identify problematic code areas.Simply build the project, and the build can be handed over to QA. They can test the required screens, record measurements, and then export the data to the developers. This will help them understand how long the code took to run on different devices and what happened during the process.
Furthermore, we'll be able to identify performance dips as early as the pull request stage, without waiting for it to go into production. Demeter can also be used to analyze third-party libraries. To achieve this, we've developed a functionality extension system that makes it easy to add new plugins, significantly simplifying the developer experience.