


In this guide, I (hereinafter, "I" refers to the author bl4de ) will show you how to use web browser tools to examine the source code of a web application's client-side. This may seem strange, as a browser is probably not the best choice for such a task, but before you dive in and start intercepting HTTP requests using Burp Suite or slapping alert(1) here and there for endless XSS attacks, it's always a good idea to thoroughly understand your target first.
This post is primarily intended for novice bug bounty hunters with little or no experience in HTML and JavaScript code analysis, but I hope more experienced hackers will also find something interesting")
The idea for this post came to me when one of my recent tweets with a very simple tip garnered a lot of attention in the community:
Since this simple tip is really just the tip of the iceberg, instead of posting similar tips on Twitter, where they're easy to lose, I decided to collect a couple of them in one post. I hope some of you find them useful.
So, let's get started then!
Another tool that's a good idea to have installed is an IDE (integrated development environment) or any code editor with HTML and JavaScript syntax highlighting. Depending on your preference, you might choose Visual Studio Code. VSCode is available for major operating systems at https://code.visualstudio.com/ . NetBeans is a completely free, open-source IDE that supports multiple programming languages, including HTML and JavaScript syntax highlighting. Download NetBeans at https://netbeans.org/
It's also a good idea to install NodeJS (and get familiar with how it works—there are literally thousands of excellent resources online for that). The address is: https://nodejs.org/en/download/package-manager/
The Python interpreter is the next must-have for me (if you're using a *NIX-based operating system, you probably already have it installed. If you're a Windows user, you'll need to install Python yourself). The ability to program in Python is invaluable, and I recommend everyone try it, even if they've never written a line of code in any programming language.
NodeJS is very useful for running and testing JavaScript code in the terminal (you can achieve the same thing using a browser, but we'll come back to that later and discuss some of the pros and cons). Python is useful for creating your own scripts, such as tools, quick proofs of concept (PoCs), and real exploits—I'll also present some of my own tools later in this article. If you're more familiar with another interpreted language (Ruby, PHP, Perl, Bash, and so on), you can also use them if you prefer. The main advantage of such languages is that scripts can be run without compilation, directly from the command line; they are 100% portable across different platforms; and they have numerous features built into thousands of libraries or modules available across the web.
Okay, it's finally time to get to work.
But if you look at the source code (using CTRL+U or CMD+Option+U on macOS), you can see a wealth of code (unfortunately, I can't provide the URL for the website in the screenshot, as it's taken from a private bug bounty program). Why can't these elements be visible in the browser?
It's important to understand that some HTML tags don't render (or display) any content on the page. There are several, but the most common are <html>, <head>, <body>, <style>, or <script>. CSS also allows you to hide elements (for example, by setting their width and height in CSS properties to 0 or setting display to none).
Let's consider the following example:
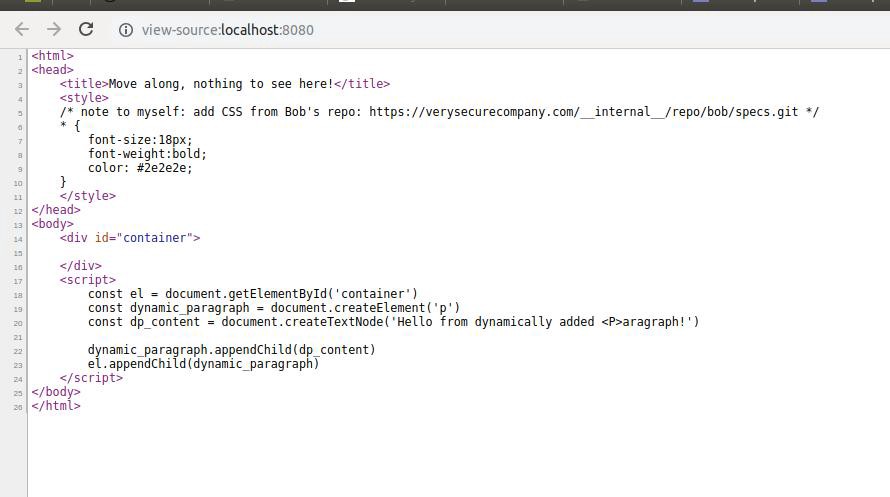
If you open this simple HTML in a browser, no content will be displayed and you won't see anything inside. But if you look at the source code, things get much more interesting (using CTRL+U or CMD+Option+U (macOS) you can view the source code of websites):
https://yandex.ru/an/count/WsuejI_z...code-active-testids=1525729,0,78;1485711,0,32
https://yandex.ru/an/count/WmKejI_z...code-active-testids=1525729,0,78;1485711,0,32
https://yandex.ru/an/count/WmKejI_z...code-active-testids=1525729,0,78;1485711,0,32
There's so much valuable information here: URLs to internal resources, a "hidden" frame with a login form, and even a diagnostic message with some credentials that will be printed in the developer tools console. None of these elements are visible on the page. While you shouldn't expect to find this kind of information on every website, commented-out JavaScript code fragments are very common, and they sometimes reveal actual API endpoints that are still accessible on the app's server.
But the View Page Source option doesn't give you the full picture, as it only shows the current HTML document. What's more interesting are all the additional resources loaded by <iframe>, <script>, or similar tags. You can see these resources in the Sources panel of Chrome Developer Tools (the Sources tab allows you to see all resources loaded by a website):
In the tree, you can see the index node —this is the main HTML document, which you can also view using the View Page Source option . All other resources are present as a standard tree of folders and files. If you click on any of these files, you'll see its contents on the right side. In the screenshot, you can see the jquery.min.js file—it's common practice to create minified versions of all JavaScript files (which is good for web app performance). But if you click the small {} icon at the bottom, DevTools will display the code in a much more readable format.
Some websites use a special feature known as a source map (a resource map is used to map the names of minified functions, variables, and objects to their "real" names and positions in the original source code—you can find more about resource maps here ). Resource maps make formatted code even more readable by providing meaningful names for all objects, instead of shorthand identifiers from the JavaScript minifier.
Another very powerful feature available in this tab is global search. Let's say you've noticed the definition of an interesting function and want to see if it's called anywhere else in the code. Perhaps this function contains an eval() call with a URL as a parameter, which could then be used to execute arbitrary JavaScript code. To search across all files listed in the Sources tab , you can use the shortcut CTRL+Shift+F ( CMD+Option+F on macOS). In the following example, I'm trying to find all references to the getAccount() function from the AppMeasurement.js file. As you can see, this function is called only once, in the same file, but if there were any other matches of the search string in any of the files, we would see them in the results list:

Sometimes you'll find that your search results were found in a very, very long string (usually a minified JavaScript file). You can simply click on it, and when DevTools opens the file, click the {} icon , and it will show you an easy-to-read version of your results—right where you need them, even if the file contains thousands of lines.
The second tab where you can explore source code is called Elements . There's one very important difference between what you can see in the file (index) of the Sources tab (and what you can see using the View Source option ) and the content presented in Elements .
(index) and " View Source " show the HTML file downloaded from the server. Elements shows you the current DOM tree with all the elements created and added by JavaScript. To understand the difference, I'll show you another small example, but first, the theory.
The DOM (Document Object Model) is the actual representation of all HTML nodes on a website. It's a tree with a single root element (<html>) and two main child elements: <head> and <body>. All other elements are children of either <head> (such as <title> or <meta>) or <body> (<div>, <p>, <img>, and so on).
When you open a URL in your browser, the HTML file is first downloaded and parsed by the browser engine. When the browser encounters a <script> or <style> tag (or any other tag with a src argument, such as an image or video file), it stops parsing the HTML and loads the file. If the file is executable JavaScript, it is executed immediately. If it's a stylesheet, the CSS rules are applied as soon as they are parsed by the CSS parser. The whole thing looks like this image (it's greatly simplified, but good enough to understand the concept):
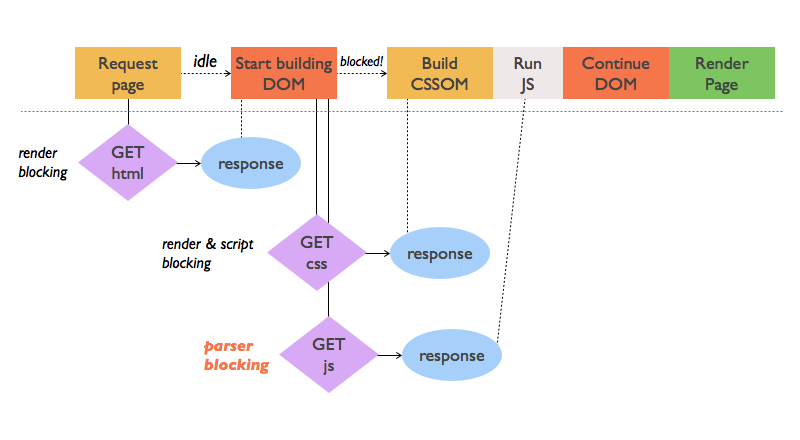
Source: https://www.sitepoint.com/optimizing-critical-rendering-path/
https://yandex.ru/an/count/Wn0ejI_z...5729,0,78;1485711,0,32&subDesignId=1000870001
But what does this have to do with the differences between the contents of Elements and Sources ? Consider the following example, where JavaScript adds an element to the DOM:
When you open this page in a browser and examine the source code, you will see exactly the same thing as shown in the screenshot above:
This is a very simple example of how JavaScript adds a new element to the DOM tree. To see the difference, use the Elements tab in DevTools:

When you compare what's present in Elements with the version you can see using View Page Source , you'll easily notice the difference: in the former case, you can see the <p> element added as a child of the <div id="container"> element. Previously, you couldn't see this element in the source code because it doesn't exist as part of the source code.
If you're working with a Single Page Application (SPA) that uses a framework like AngularJS, React, Vue.js, Ember.js, and so on, you'll see a lot of dynamically generated content in the Elements tab . This content can vary, but typically includes forms, dynamic tables or lists with sorting and pagination, search functionality, and a plethora of elements that, for example, can expose DOM-based XSS or process user input in template expressions (like {{ }} in AngularJS).
Such applications often use parameters passed via GET or POST requests or store them in cookies or browser storage to construct website content. They also create a lot of their own content. There's always a chance of finding a vulnerability here.
Before we get into the JavaScript itself, one more important thing worth mentioning here: always read all HTML comments you find in the source code, as they aren't displayed on the page. You'll be surprised how much valuable information you can find there.
Browser Storage is another place where you can find a wealth of valuable information. There are two types of storage: Local Storage and Session Storage. The difference between them is that the contents of Session Storage are lost when the application closes (when you close a browser tab or the browser itself). Local Storage can retain data for as long as it's not explicitly cleared (data doesn't expire—that is, it's automatically deleted after a certain period).
To view all the information stored in various locations, you can use the Application tab in DevTools:
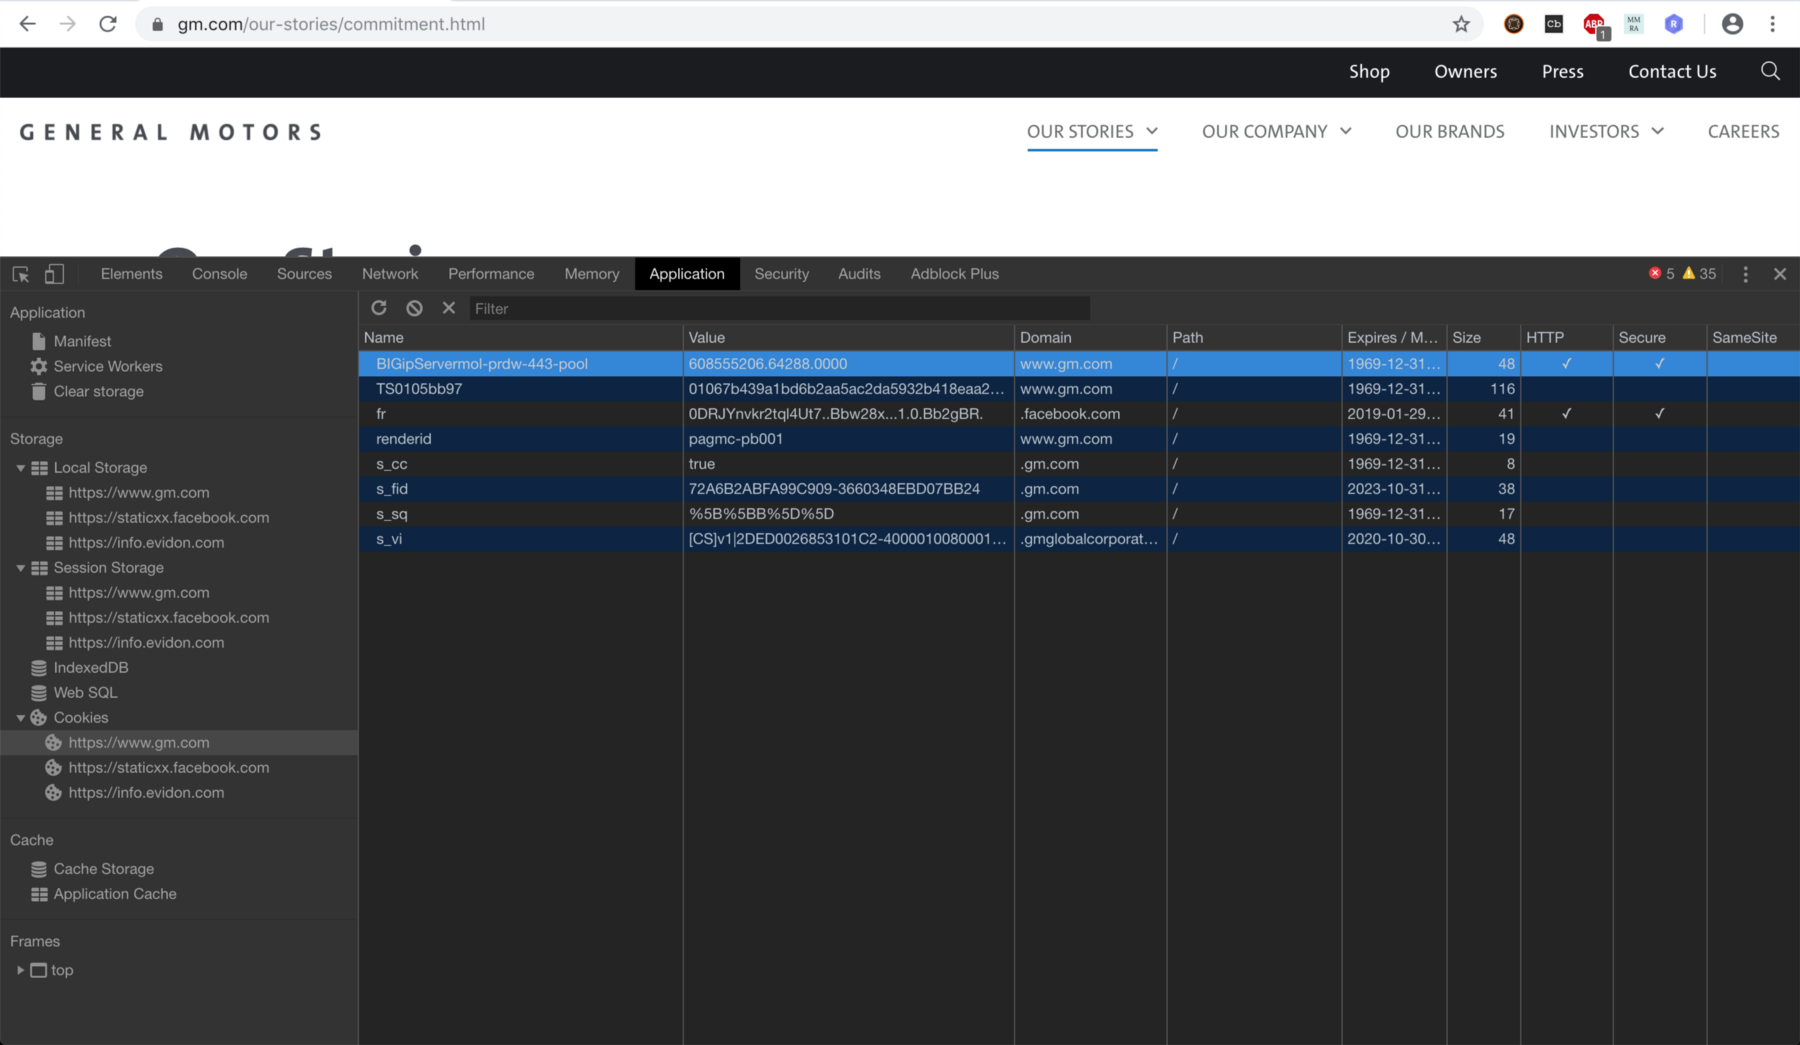
Using the Application tab , you can not only view content, but also modify it, delete, or add your own key-value pairs to see if you can trigger unexpected behavior or even exploit a vulnerability. This is the easiest way to test, for example, whether you can impersonate another user by changing a session token—simply change the value of the cookie that stores the session identifier (this is just an example, as many modern web applications use multiple methods of user identification, and in most cases, changing the value of a single cookie is not enough to hijack another user's session):
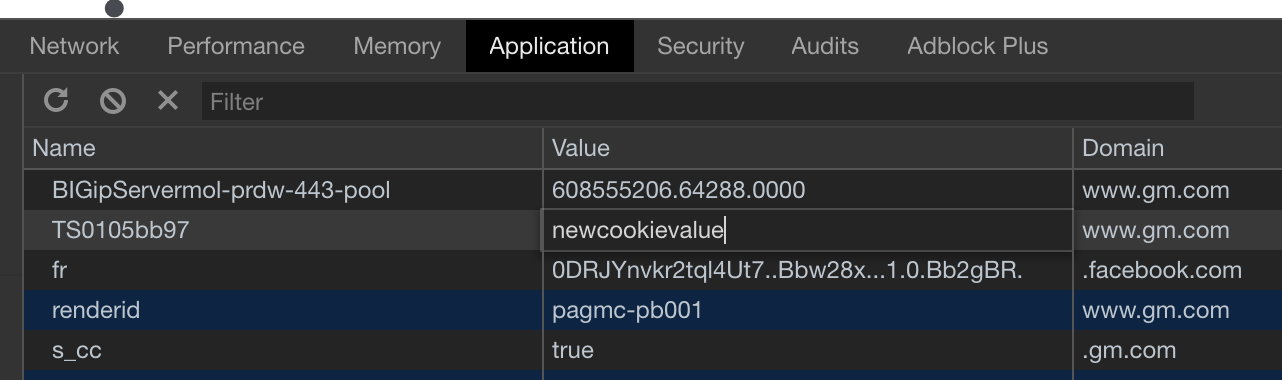
In the screenshot above, the value of cookie TS0105bb97 was changed directly in the Application → Cookies tab in DevTools.
There's another place in this tab where you can find JavaScript source code related to a web application: Service Workers . This is one of many introductions to Service Workers you can find online: https://developers.google.com/web/fundamentals/primers/service-workers/
This is a fairly new thing and not many web apps use it, but they are still a valuable source of information about how a web app performs, especially how it performs when it goes offline.
https://yandex.ru/an/count/WwmejI_z...5729,0,78;1485711,0,32&subDesignId=1000870001
There are several ways to analyze JavaScript code. Let's start with the browser. We've already explored the Sources tab and how the {} feature is used to convert minified source code into readable code. But with DevTools, you can do even more, and one of the best features is the JavaScript debugger.
From a bug bounty hunter's perspective, debugging allows you to better understand how an application works and directly test the payload where it's injected. You can easily isolate the vulnerable part of the program and focus on testing it with all the benefits of a debugger. For example, imagine you've found a vulnerable redirect function, but every time you try to see what's going on, the function is called, and the browser redirects to an external source. You can't see any JavaScript code left on the previous page because you're immediately redirected to a new page.
Setting a breakpoint at the beginning of the redirect function will prevent the browser from performing the redirect and you can now read the source code of the function to understand how it works, how you can inject your payload, whether there is any encoding implementation, and so on.
Well, enough theory, it's time for practice.
This is an example of implementing the redirect function:
When you open this website in your browser, after 10 seconds it will redirect you to the HackerOne website and you will no longer be able to see the source code of the original website, meaning there is no way to see what just happened.
Open Developer Tools in your browser and switch to the Sources tab , then open the HTML file above. You now have 10 seconds to set a breakpoint at line number 16 ( if (url) { ). To do this, simply click 16 in the left-hand line bar. After 10 seconds, the browser will call redirect() and immediately stop execution at the line where the breakpoint was set (our simple app with a redirect is stopped in the debugger):
The blue line is the line of code that will be executed when we move on (it hasn't executed yet! This is very important to know). On the left, you can see the debug panel—it shows where you are now ( Call stack ), and if you expand the Script node , you'll see the values of all the variables defined in the current execution context (in our case, only url).
Now you can spend as much time as you need reading and understanding the code. As we already know, we'll be redirected to the HackerOne website, but only if the condition on line 16 evaluates to true .
Then let's change the value of url . We'll change it to something that returns false in JavaScript so the condition isn't met (this could be an empty string, 0, a boolean false , or any other expression that evaluates to false). We'll stick with false (to change the variable's value, simply click on it and enter your own value):
Now let's check what's changed. We'll proceed step by step. Take a look at the icons at the top of the debugger panel:
The first icon simply continues program execution, while the second allows you to step through the code (we'll use this one). The next icon allows you to jump into a function called at a specific line (the debugger doesn't step into the function itself until a breakpoint is set; it simply executes the line containing the function call and moves to the next line). Then there's an icon to back out of the currently executing function and return to the point where it was called.
Now click on the second icon (make sure you change the value of the url variable to false and you will notice that the next line to execute is 19 (this is because on line 16 the condition result was false):

We just changed the flow of execution of the application.
If you click the first button icon in the debug toolbar (the play-pause icon), you'll notice that this time the app will try to redirect you to an internal url at company.com.
This gives us an idea that the url parameter might be vulnerable, so now you can try to exploit this feature to look for Open Redirection or Reflected XSS, or go deeper in case you expect that the value from the url might be stored somewhere on the server side (you can find out if this is the case by continuing to investigate the program logic).
But let's assume you've identified a function that checks whether the supplied value is valid, and you want to focus only on its logic.
In the Sources tab , you will find a panel called Snippets :

When you click it, you'll see a list of snippets (if you've already created any) and the option to create a new one. Click this option, and in the middle pane, you'll find a simple code editor with syntax highlighting. Any JavaScript code you enter here can be run, and the result will be immediately displayed in the console that appears below as soon as you run your snippet. To do this, you can use the "Play" icon at the bottom left of this pane, or simply press CMD+Enter on macOS or CTRL+Enter on other systems.
You can edit your code and run it as many times as you want. But, as I mentioned at the beginning of this post, there are some pros and cons.
Snippets run in the context of the page loaded in the tab where you opened DevTools and created and ran your snippet. Also, each time you run your snippet, it runs using the same context. This means that all variables you previously set and haven't changed are still there and retain their last value.
Why is this important?
Let's look at this example: a snippet with a constant is run for the first time:
In JavaScript, when you define a constant using the const keyword , you must initialize it with a value, and that value can't be changed later. As you can see, the snippet works as expected, but if you now try to change the value used to initialize SOME_CONST and rerun the snippet, you'll get a syntax error caused by initializing the constant twice in the same execution context:
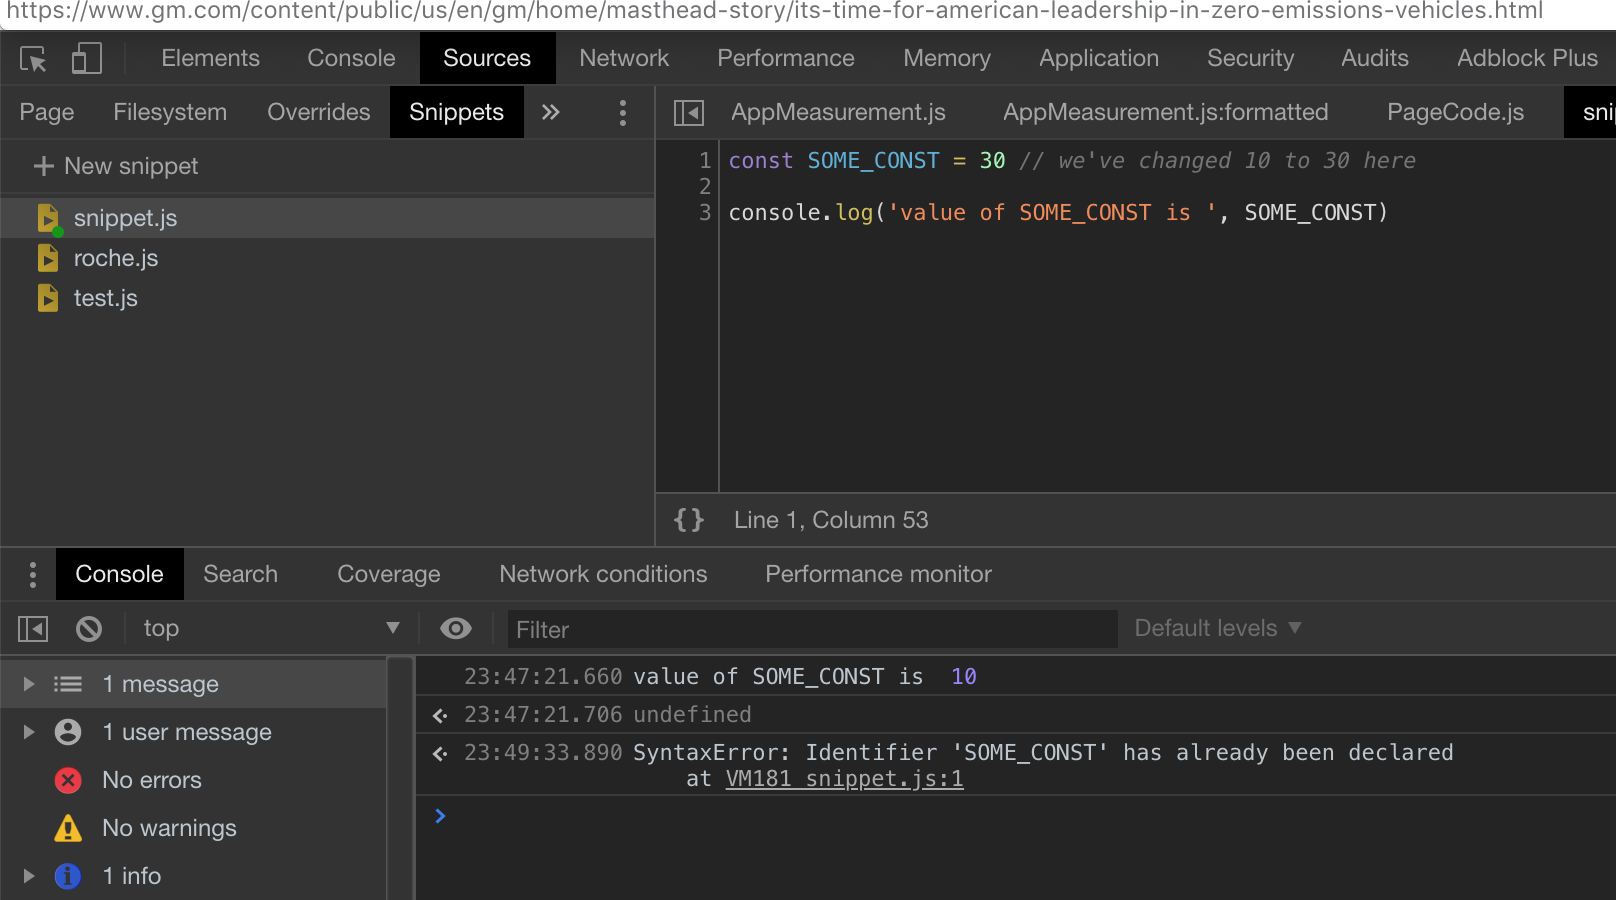
The reason for the error is that SOME_CONST has already been initialized in this context. DevTools simply "thinks" you're continuing to execute code in the same execution context, and it doesn't matter that you've edited the code.
Therefore, if you, for example, run a running program with a debugger (all variables, objects, and functions defined by the application code will now exist in the execution context) and try to create a snippet in the same tab using one of the existing identifiers, you will either overwrite something in the original web application code or get an error if you use an identifier or something that cannot be reinitialized (like a constant). To be able to rerun the snippet, you must first reload the page in the browser to obtain a fresh, empty execution context (the browser does not remember the state of the web application between restarts, since a restart results in a complete process of reloading resources, building the DOM tree, etc.).
To avoid such problems, instead of using Snippets (which can be a very useful tool since you can simply open a new tab with DevTools and create your own snippet there) you can run your code using the NodeJS JavaScript runtime.
To do this, simply place the code you want to run in a new JavaScript file and run it with NodeJS (make sure you installed it first) using the terminal:
In the screenshot, the code is run three times, each time with a new value used in the SOME_CONST initializer .
I ran this code three times, changing the SOME_CONST value each time. As you can see, there were no errors, and each execution was successful and produced the correct result.
This behavior stems from the nature of NodeJS - every time you run JavaScript code using it, it creates a new execution target, so there is no way to run the same code twice using the same execution target.
The first is sources , a term that describes all the points where user input meets application code. In the application's business logic, this could be an argument passed via GET in a URL, a cookie read by the application, or the contents of Local Storage.
The second is called an execution sink. This term refers to any JavaScript syntax element or HTML API function that executes the code passed to it as an argument. One obvious example is the JavaScript function eval(code_to_execute) , which evaluates (executes) the code passed to it as an argument. Another example is setTimeout(function_to_execute, timeout_in_milliseconds) , which executes the function passed as the first argument after a certain amount of time, specified by the second argument, has passed.
The process of detecting a vulnerability in a web application involves finding connections between a source and the execution sink that actually processes that source. In the example where I demonstrated how to use the debugger, the url argument (the source) was directly used in location.href (the execution sink). Another example would be a function that evaluates the data the user submitted to an HTML form input field (JavaScript can read it using a DOM API, such as document.getElementById('input_id').value , and assigns it to a variable, which in this case would be the source) and then passes this value to another element's innerHTML() method, updating the current DOM in the browser window (which would be the execution sink).
The author recommends the video , but it's in English. The gist of the video: there's user input, and there are functions in which it can be executed. Under certain conditions, this can be used maliciously—this is what causes a vulnerability, such as an arbitrary command execution vulnerability.
A web application can have a variety of execution sources and sinkholes depending on its business logic (form fields, URL parameters, cookies, browser storage, WebSockets, etc.). But the most important thing is whether they are used as execution sinkholes. There are a plethora of them, including location properties such as hash , window.open() , document.write() , or DOM methods such as innerHTML or appendChild . They can all be used to execute arbitrary code, perform redirects, or perform other types of injections.
To easily identify such source code patterns, I (meaning bl4de ) created the tool nodestructor . It inspects JavaScript files (both individual files and all JavaScript files in a directory specified as an argument), finding patterns that are well-known as execution sinkholes (or sources). Don't assume that every line of code found by nodestructor is immediately or easily exploitable—it all depends on what happens between the source and the execution sink (sanitization, encoding, parsing, data transformation into an object, string manipulation, etc.). The main goal of this tool is to provide an easy-to-use and fast way to find all patterns in large volumes of code.
Let's look at a quick example. First, we need a JavaScript file to analyze. The file I'm going to check is AppMeasurement.js from GM.com, which we saw earlier. I simply copy it from the browser (after first converting it to a readable format) and paste it into the code editor, then save it to my local storage in the /tmp folder.
In the terminal, I run nodestructor on the AppMeasurement.js file (with the -H option to also include searching for various HTML5 API patterns):

As you may have noticed, the tool identified a couple of potential execution sinkholes. Many of these are false positives, but for the purposes of this presentation, let's focus on the second one, which appears to be initializing the domain variable with the result of the location.hostname.toLowerCase() function .
It would be nice to be able to follow all occurrences of this variable in a file to determine whether it is subsequently used as an execution sink. You can use Studio Code's built-in functions, such as Find all references, or simply search for the domain string.
The author is working on another tool that isn't yet ready, but is intended to automate the described task. The result of the analysis to determine the use of the domain variable :
In the future, the author hopes to make this tool capable of performing more complex analysis, such as finding the use of a variable across different execution scopes (for example, if it is passed as an argument to a function or is actually used as an argument to any execution funnel).
This post is primarily intended for novice bug bounty hunters with little or no experience in HTML and JavaScript code analysis, but I hope more experienced hackers will also find something interesting
The idea for this post came to me when one of my recent tweets with a very simple tip garnered a lot of attention in the community:
If you open a URL in your browser and see nothing but a blank page, don't assume there's nothing there. ALWAYS check the source code. It might contain a bunch of JavaScript or, for example, commented source code from the server:
Since this simple tip is really just the tip of the iceberg, instead of posting similar tips on Twitter, where they're easy to lose, I decided to collect a couple of them in one post. I hope some of you find them useful.
So, let's get started then!
Tool kit
Every modern web browser today has a set of built-in developer tools. To enable them, you can use Ctrl+Shift+I , CMD+Option+I (macOS), the F12 key , or simply find the option in the browser menu—it depends on the operating system and browser you're using. While I'll be using the latest version of Chromium in this post, there aren't many differences (other than the user interface) whether you're using Firefox, Safari, Chrome, or Edge. It's your choice, but I've found Chrome Developer Tools to be the most functional (Chrome Developer Tools, or simply DevTools, are available in Chrome, Chromium, Brave, Opera, or any other Chromium-based browser). Developer tools are available by default, meaning you don't need to install them separately. If you have a web browser, you already have the Developer Tools.Another tool that's a good idea to have installed is an IDE (integrated development environment) or any code editor with HTML and JavaScript syntax highlighting. Depending on your preference, you might choose Visual Studio Code. VSCode is available for major operating systems at https://code.visualstudio.com/ . NetBeans is a completely free, open-source IDE that supports multiple programming languages, including HTML and JavaScript syntax highlighting. Download NetBeans at https://netbeans.org/
It's also a good idea to install NodeJS (and get familiar with how it works—there are literally thousands of excellent resources online for that). The address is: https://nodejs.org/en/download/package-manager/
The Python interpreter is the next must-have for me (if you're using a *NIX-based operating system, you probably already have it installed. If you're a Windows user, you'll need to install Python yourself). The ability to program in Python is invaluable, and I recommend everyone try it, even if they've never written a line of code in any programming language.
NodeJS is very useful for running and testing JavaScript code in the terminal (you can achieve the same thing using a browser, but we'll come back to that later and discuss some of the pros and cons). Python is useful for creating your own scripts, such as tools, quick proofs of concept (PoCs), and real exploits—I'll also present some of my own tools later in this article. If you're more familiar with another interpreted language (Ruby, PHP, Perl, Bash, and so on), you can also use them if you prefer. The main advantage of such languages is that scripts can be run without compilation, directly from the command line; they are 100% portable across different platforms; and they have numerous features built into thousands of libraries or modules available across the web.
Okay, it's finally time to get to work.
Examining HTML source code
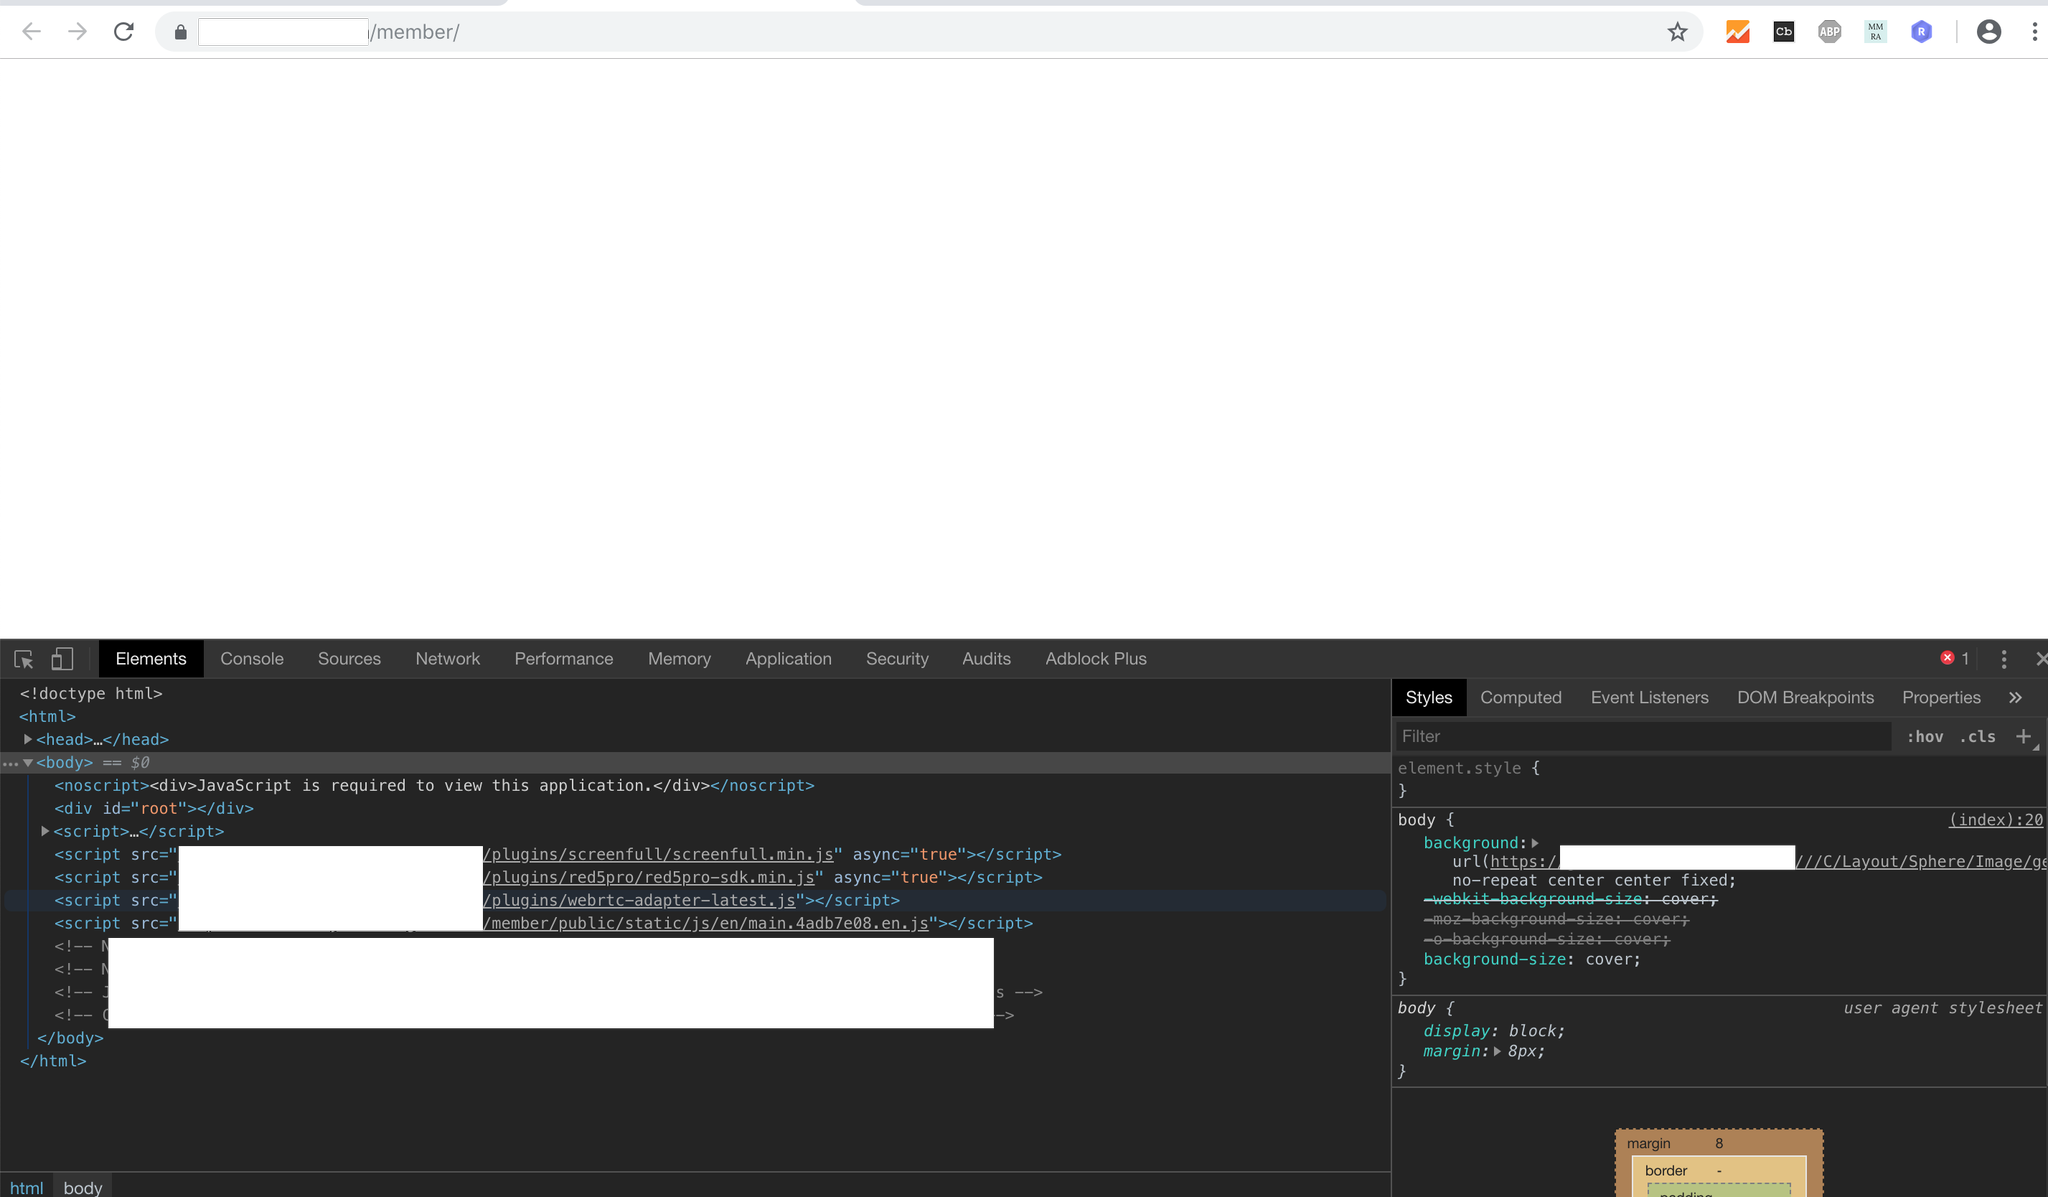
Let's quickly return to my tweet that I quoted earlier. As you can see, the screenshot shows a website that appears to have no content, just a white, empty page.But if you look at the source code (using CTRL+U or CMD+Option+U on macOS), you can see a wealth of code (unfortunately, I can't provide the URL for the website in the screenshot, as it's taken from a private bug bounty program). Why can't these elements be visible in the browser?
It's important to understand that some HTML tags don't render (or display) any content on the page. There are several, but the most common are <html>, <head>, <body>, <style>, or <script>. CSS also allows you to hide elements (for example, by setting their width and height in CSS properties to 0 or setting display to none).
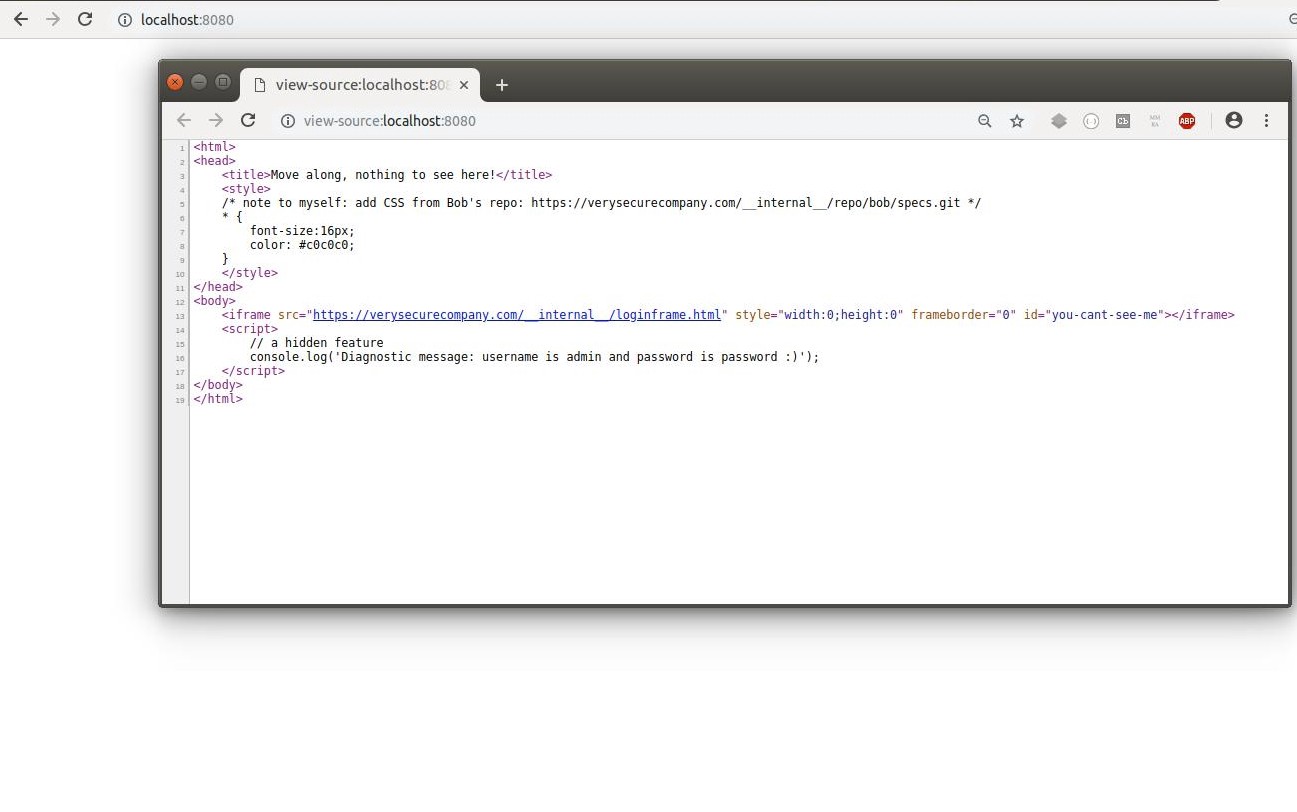
Let's consider the following example:
| 1 2 3 4 5 6 7 8 9 10 11 12 13 14 15 16 17 18 19 | <html> <head> <title>Move along, nothing to see here!</title> <style> /* note to myself: add CSS from Bob's repo: https://verysecurecompany.com/__internal__/repo/bob/specs.git */ * { font-size:16px; color: #c0c0c0; } </style> </head> <body> <iframe src="https://verysecurecompany.com/__internal__/loginframe.html" style="width:0;height:0" frameborder="0" id="you-cant-see-me"></iframe> <script> // a hidden feature console.log('Diagnostic message: username is admin and password is password '); </script> </body> </html> |
https://yandex.ru/an/count/WsuejI_z...code-active-testids=1525729,0,78;1485711,0,32
https://yandex.ru/an/count/WmKejI_z...code-active-testids=1525729,0,78;1485711,0,32
https://yandex.ru/an/count/WmKejI_z...code-active-testids=1525729,0,78;1485711,0,32
There's so much valuable information here: URLs to internal resources, a "hidden" frame with a login form, and even a diagnostic message with some credentials that will be printed in the developer tools console. None of these elements are visible on the page. While you shouldn't expect to find this kind of information on every website, commented-out JavaScript code fragments are very common, and they sometimes reveal actual API endpoints that are still accessible on the app's server.
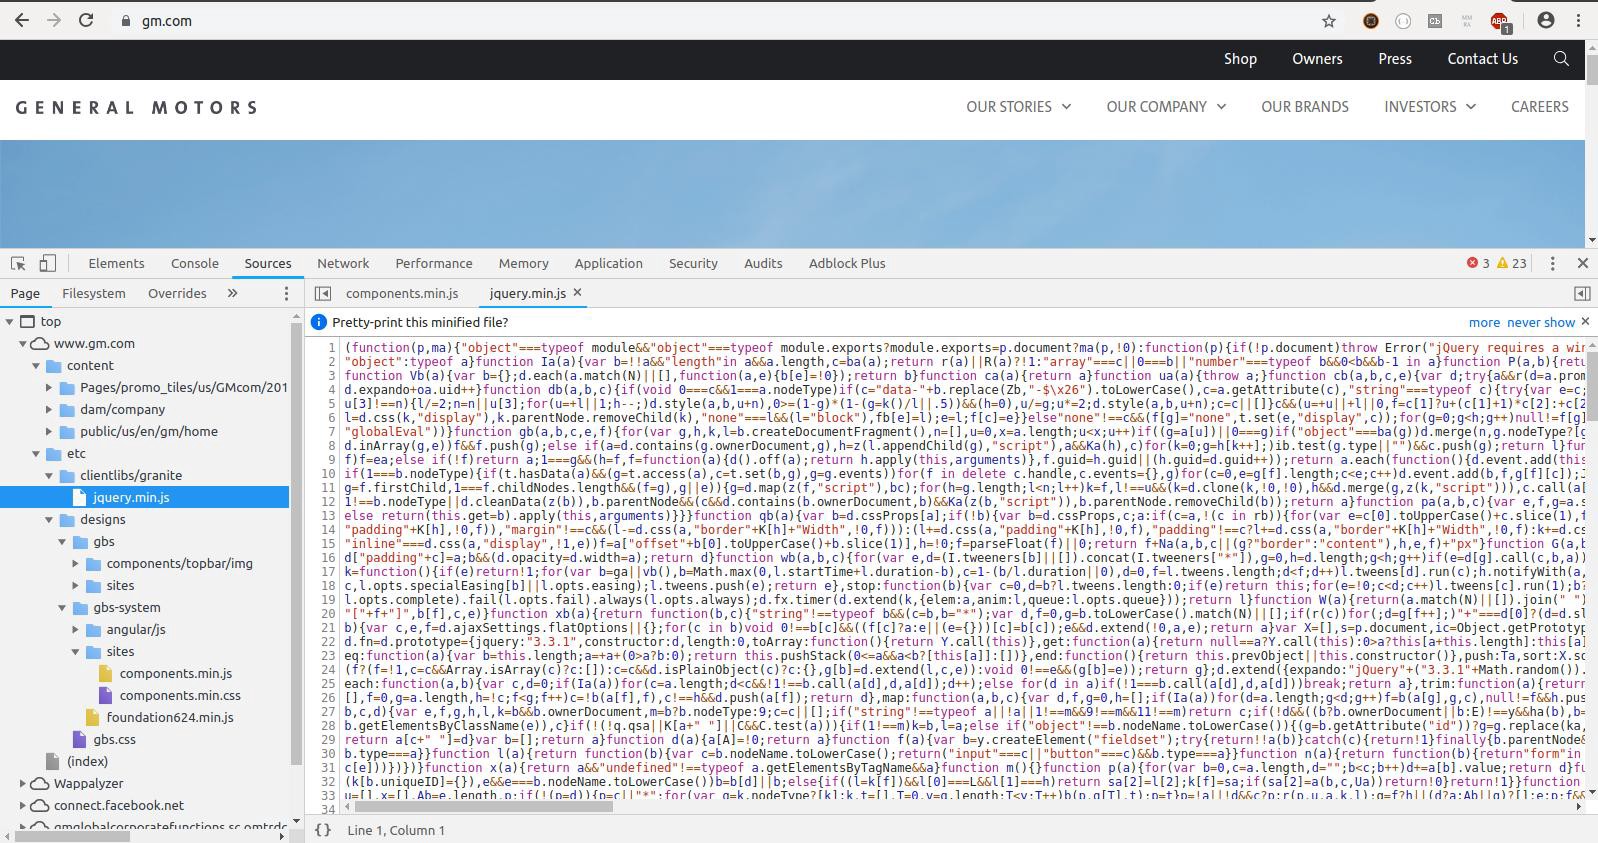
But the View Page Source option doesn't give you the full picture, as it only shows the current HTML document. What's more interesting are all the additional resources loaded by <iframe>, <script>, or similar tags. You can see these resources in the Sources panel of Chrome Developer Tools (the Sources tab allows you to see all resources loaded by a website):
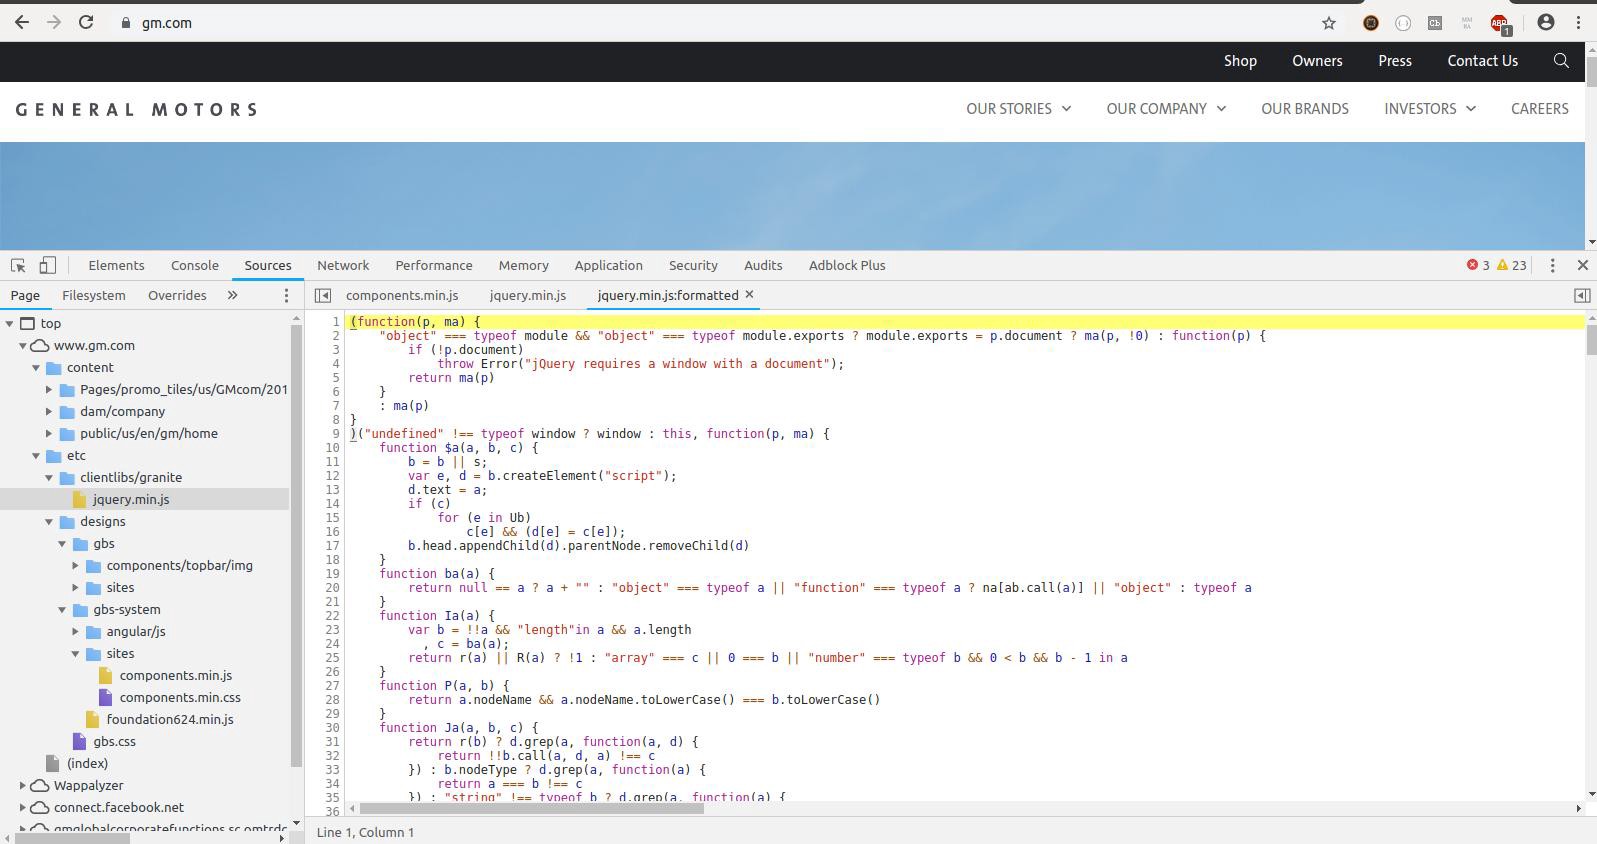
In the tree, you can see the index node —this is the main HTML document, which you can also view using the View Page Source option . All other resources are present as a standard tree of folders and files. If you click on any of these files, you'll see its contents on the right side. In the screenshot, you can see the jquery.min.js file—it's common practice to create minified versions of all JavaScript files (which is good for web app performance). But if you click the small {} icon at the bottom, DevTools will display the code in a much more readable format.
Some websites use a special feature known as a source map (a resource map is used to map the names of minified functions, variables, and objects to their "real" names and positions in the original source code—you can find more about resource maps here ). Resource maps make formatted code even more readable by providing meaningful names for all objects, instead of shorthand identifiers from the JavaScript minifier.
Another very powerful feature available in this tab is global search. Let's say you've noticed the definition of an interesting function and want to see if it's called anywhere else in the code. Perhaps this function contains an eval() call with a URL as a parameter, which could then be used to execute arbitrary JavaScript code. To search across all files listed in the Sources tab , you can use the shortcut CTRL+Shift+F ( CMD+Option+F on macOS). In the following example, I'm trying to find all references to the getAccount() function from the AppMeasurement.js file. As you can see, this function is called only once, in the same file, but if there were any other matches of the search string in any of the files, we would see them in the results list:
Sometimes you'll find that your search results were found in a very, very long string (usually a minified JavaScript file). You can simply click on it, and when DevTools opens the file, click the {} icon , and it will show you an easy-to-read version of your results—right where you need them, even if the file contains thousands of lines.
The second tab where you can explore source code is called Elements . There's one very important difference between what you can see in the file (index) of the Sources tab (and what you can see using the View Source option ) and the content presented in Elements .
(index) and " View Source " show the HTML file downloaded from the server. Elements shows you the current DOM tree with all the elements created and added by JavaScript. To understand the difference, I'll show you another small example, but first, the theory.
The DOM (Document Object Model) is the actual representation of all HTML nodes on a website. It's a tree with a single root element (<html>) and two main child elements: <head> and <body>. All other elements are children of either <head> (such as <title> or <meta>) or <body> (<div>, <p>, <img>, and so on).
When you open a URL in your browser, the HTML file is first downloaded and parsed by the browser engine. When the browser encounters a <script> or <style> tag (or any other tag with a src argument, such as an image or video file), it stops parsing the HTML and loads the file. If the file is executable JavaScript, it is executed immediately. If it's a stylesheet, the CSS rules are applied as soon as they are parsed by the CSS parser. The whole thing looks like this image (it's greatly simplified, but good enough to understand the concept):
Source: https://www.sitepoint.com/optimizing-critical-rendering-path/
https://yandex.ru/an/count/Wn0ejI_z...5729,0,78;1485711,0,32&subDesignId=1000870001
But what does this have to do with the differences between the contents of Elements and Sources ? Consider the following example, where JavaScript adds an element to the DOM:
| 1 2 3 4 5 6 7 8 9 10 11 12 13 14 15 16 17 18 19 20 21 22 23 24 25 | <html> <head> <title>Dynamic P Application</title> <style> * { font-size:18px; font-weight:bold; color: #2e2e2e; } </style> </head> <body> <div id="container"> </div> <script> const el = document.getElementById('container') const dynamic_paragraph = document.createElement('p') const dp_content = document.createTextNode('Hello from dynamically added <P>aragraph!') dynamic_paragraph.appendChild(dp_content) el.appendChild(dynamic_paragraph) </script> </body> </html> |
This is a very simple example of how JavaScript adds a new element to the DOM tree. To see the difference, use the Elements tab in DevTools:
When you compare what's present in Elements with the version you can see using View Page Source , you'll easily notice the difference: in the former case, you can see the <p> element added as a child of the <div id="container"> element. Previously, you couldn't see this element in the source code because it doesn't exist as part of the source code.
If you're working with a Single Page Application (SPA) that uses a framework like AngularJS, React, Vue.js, Ember.js, and so on, you'll see a lot of dynamically generated content in the Elements tab . This content can vary, but typically includes forms, dynamic tables or lists with sorting and pagination, search functionality, and a plethora of elements that, for example, can expose DOM-based XSS or process user input in template expressions (like {{ }} in AngularJS).
Such applications often use parameters passed via GET or POST requests or store them in cookies or browser storage to construct website content. They also create a lot of their own content. There's always a chance of finding a vulnerability here.
Before we get into the JavaScript itself, one more important thing worth mentioning here: always read all HTML comments you find in the source code, as they aren't displayed on the page. You'll be surprised how much valuable information you can find there.
Researching Cookies and Browser Storage
The next thing you can do with Developer Tools is check whether a website stores any client-side information. There are a couple of places a web application can use this. The most common and popular are cookies —small pieces of data identified by name (you can think of cookies as simple key-value pairs) exchanged between the server and browser in HTTP requests and responses.Browser Storage is another place where you can find a wealth of valuable information. There are two types of storage: Local Storage and Session Storage. The difference between them is that the contents of Session Storage are lost when the application closes (when you close a browser tab or the browser itself). Local Storage can retain data for as long as it's not explicitly cleared (data doesn't expire—that is, it's automatically deleted after a certain period).
To view all the information stored in various locations, you can use the Application tab in DevTools:
Using the Application tab , you can not only view content, but also modify it, delete, or add your own key-value pairs to see if you can trigger unexpected behavior or even exploit a vulnerability. This is the easiest way to test, for example, whether you can impersonate another user by changing a session token—simply change the value of the cookie that stores the session identifier (this is just an example, as many modern web applications use multiple methods of user identification, and in most cases, changing the value of a single cookie is not enough to hijack another user's session):
In the screenshot above, the value of cookie TS0105bb97 was changed directly in the Application → Cookies tab in DevTools.
There's another place in this tab where you can find JavaScript source code related to a web application: Service Workers . This is one of many introductions to Service Workers you can find online: https://developers.google.com/web/fundamentals/primers/service-workers/
This is a fairly new thing and not many web apps use it, but they are still a valuable source of information about how a web app performs, especially how it performs when it goes offline.
JavaScript Research
Now let's move on to the part of the code that actually powers the entire web application (HTML and CSS are responsible only for the visual part, as they cannot contain any business logic. Aside from a few small exceptions, such as CSS expressions, which can run JavaScript code and thus be the source of XSS vulnerabilities if one of them uses user input, there's not much you can do with regular HTML and CSS).https://yandex.ru/an/count/WwmejI_z...5729,0,78;1485711,0,32&subDesignId=1000870001
There are several ways to analyze JavaScript code. Let's start with the browser. We've already explored the Sources tab and how the {} feature is used to convert minified source code into readable code. But with DevTools, you can do even more, and one of the best features is the JavaScript debugger.
Using the DevTools debugger
If you're not familiar with debugging, it's basically the ability to pause program execution on a specific line of code. This allows you to see the current values of variables, which functions are currently executing, and how those functions were called (this is possible thanks to the call stack—the debugger can show you the exact order of function calls: how function a() was called by function b(), and function b() was called by another function c()—just to give you an example). The debugger also allows you to step through your code (one instruction at a time), allowing you to follow every change in the program and its state. Last but not least, the debugger allows you to modify the program "on the fly," meaning you can see what happens when you modify variable values or even the logic of the program itself. Being able to use the debugger effectively is one of the most important skills a programmer can have.From a bug bounty hunter's perspective, debugging allows you to better understand how an application works and directly test the payload where it's injected. You can easily isolate the vulnerable part of the program and focus on testing it with all the benefits of a debugger. For example, imagine you've found a vulnerable redirect function, but every time you try to see what's going on, the function is called, and the browser redirects to an external source. You can't see any JavaScript code left on the previous page because you're immediately redirected to a new page.
Setting a breakpoint at the beginning of the redirect function will prevent the browser from performing the redirect and you can now read the source code of the function to understand how it works, how you can inject your payload, whether there is any encoding implementation, and so on.
Well, enough theory, it's time for practice.
This is an example of implementing the redirect function:
| 1 2 3 4 5 6 7 8 9 10 11 12 13 14 15 16 17 18 19 20 21 22 23 24 25 26 27 | <html> <head> <title>Redirection</title> </head> <body> </div> <script> // представьте, что url считывается из GET параметра... // но для упрощения мы просто записали её здесь в коде const url = 'https://hackerone.com' function redirect() { // I will redirect you! Now! if (url) { location.href = url } else { location.href = 'https://company.com/__internal__/supersecretadminpanel' } } setTimeout( redirect, 10000 ) </script> </body> </html> |
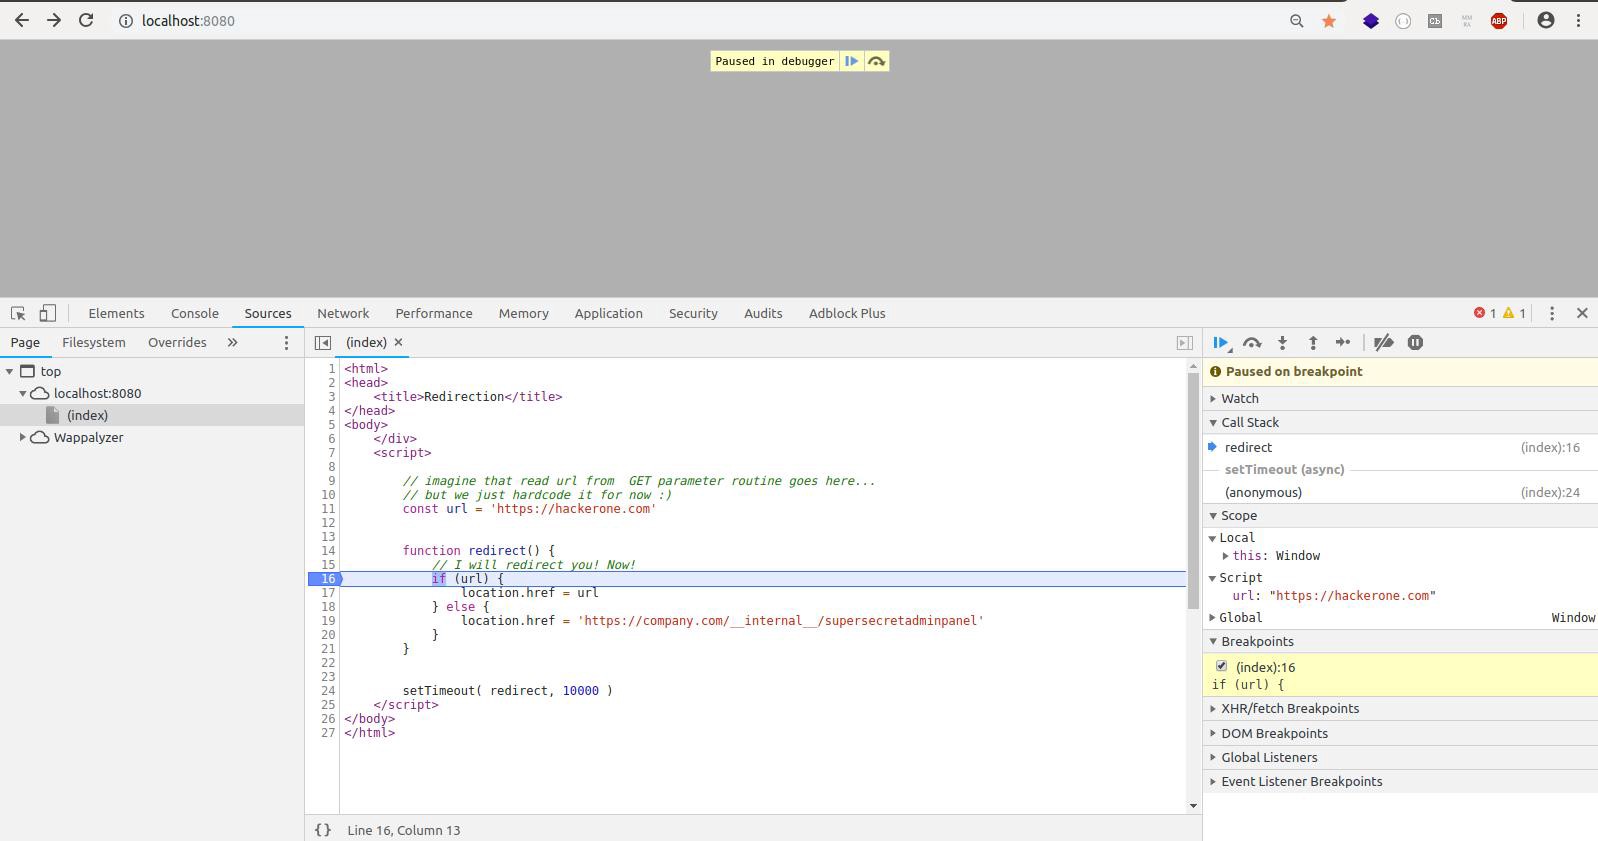
Open Developer Tools in your browser and switch to the Sources tab , then open the HTML file above. You now have 10 seconds to set a breakpoint at line number 16 ( if (url) { ). To do this, simply click 16 in the left-hand line bar. After 10 seconds, the browser will call redirect() and immediately stop execution at the line where the breakpoint was set (our simple app with a redirect is stopped in the debugger):
The blue line is the line of code that will be executed when we move on (it hasn't executed yet! This is very important to know). On the left, you can see the debug panel—it shows where you are now ( Call stack ), and if you expand the Script node , you'll see the values of all the variables defined in the current execution context (in our case, only url).
Now you can spend as much time as you need reading and understanding the code. As we already know, we'll be redirected to the HackerOne website, but only if the condition on line 16 evaluates to true .
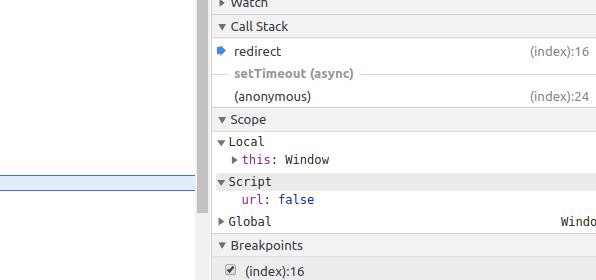
Then let's change the value of url . We'll change it to something that returns false in JavaScript so the condition isn't met (this could be an empty string, 0, a boolean false , or any other expression that evaluates to false). We'll stick with false (to change the variable's value, simply click on it and enter your own value):
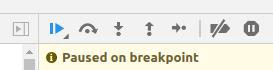
Now let's check what's changed. We'll proceed step by step. Take a look at the icons at the top of the debugger panel:
The first icon simply continues program execution, while the second allows you to step through the code (we'll use this one). The next icon allows you to jump into a function called at a specific line (the debugger doesn't step into the function itself until a breakpoint is set; it simply executes the line containing the function call and moves to the next line). Then there's an icon to back out of the currently executing function and return to the point where it was called.
Now click on the second icon (make sure you change the value of the url variable to false and you will notice that the next line to execute is 19 (this is because on line 16 the condition result was false):
We just changed the flow of execution of the application.
If you click the first button icon in the debug toolbar (the play-pause icon), you'll notice that this time the app will try to redirect you to an internal url at company.com.
This gives us an idea that the url parameter might be vulnerable, so now you can try to exploit this feature to look for Open Redirection or Reflected XSS, or go deeper in case you expect that the value from the url might be stored somewhere on the server side (you can find out if this is the case by continuing to investigate the program logic).
Executing JavaScript using Snippets
Sometimes you may want to run only a specific section of an application's code. This can be difficult and time-consuming, especially when preliminary work must be done to obtain the point of interest. In this case, you can use Snippets and run only the code you want. But keep in mind that this isn't always possible, for example when you're trying to run a section of code that has dependencies, such as variables passed from other parts, or the code fragments you want to run use other functions defined in other files.But let's assume you've identified a function that checks whether the supplied value is valid, and you want to focus only on its logic.
In the Sources tab , you will find a panel called Snippets :
When you click it, you'll see a list of snippets (if you've already created any) and the option to create a new one. Click this option, and in the middle pane, you'll find a simple code editor with syntax highlighting. Any JavaScript code you enter here can be run, and the result will be immediately displayed in the console that appears below as soon as you run your snippet. To do this, you can use the "Play" icon at the bottom left of this pane, or simply press CMD+Enter on macOS or CTRL+Enter on other systems.
You can edit your code and run it as many times as you want. But, as I mentioned at the beginning of this post, there are some pros and cons.
Snippets run in the context of the page loaded in the tab where you opened DevTools and created and ran your snippet. Also, each time you run your snippet, it runs using the same context. This means that all variables you previously set and haven't changed are still there and retain their last value.
Why is this important?
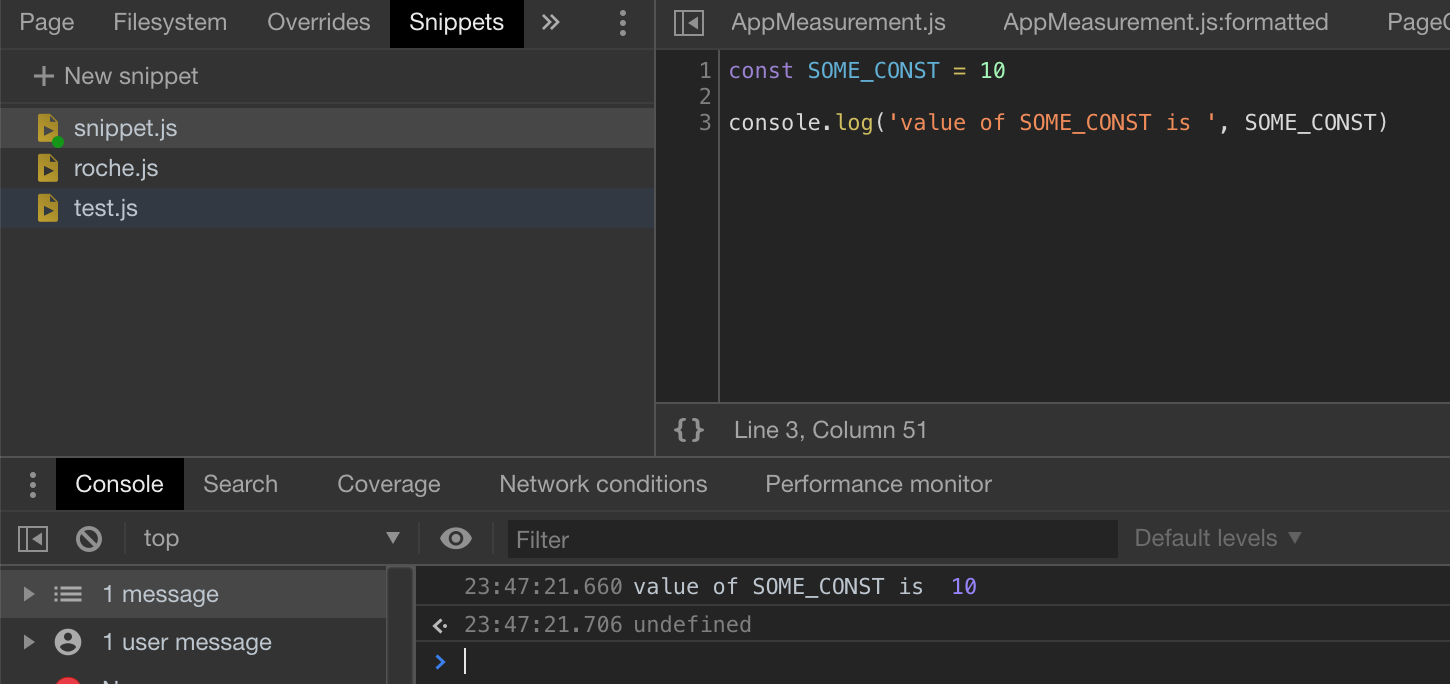
Let's look at this example: a snippet with a constant is run for the first time:
In JavaScript, when you define a constant using the const keyword , you must initialize it with a value, and that value can't be changed later. As you can see, the snippet works as expected, but if you now try to change the value used to initialize SOME_CONST and rerun the snippet, you'll get a syntax error caused by initializing the constant twice in the same execution context:
The reason for the error is that SOME_CONST has already been initialized in this context. DevTools simply "thinks" you're continuing to execute code in the same execution context, and it doesn't matter that you've edited the code.
Therefore, if you, for example, run a running program with a debugger (all variables, objects, and functions defined by the application code will now exist in the execution context) and try to create a snippet in the same tab using one of the existing identifiers, you will either overwrite something in the original web application code or get an error if you use an identifier or something that cannot be reinitialized (like a constant). To be able to rerun the snippet, you must first reload the page in the browser to obtain a fresh, empty execution context (the browser does not remember the state of the web application between restarts, since a restart results in a complete process of reloading resources, building the DOM tree, etc.).
To avoid such problems, instead of using Snippets (which can be a very useful tool since you can simply open a new tab with DevTools and create your own snippet there) you can run your code using the NodeJS JavaScript runtime.
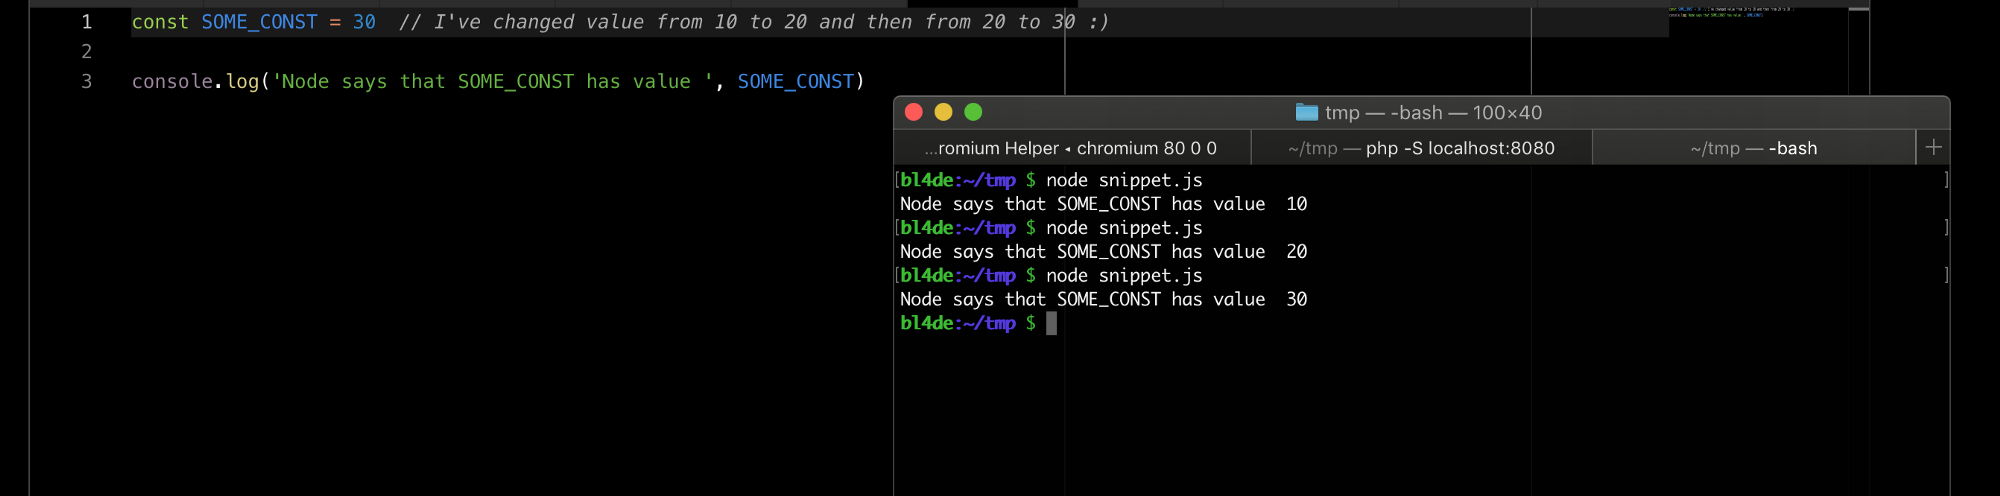
To do this, simply place the code you want to run in a new JavaScript file and run it with NodeJS (make sure you installed it first) using the terminal:
In the screenshot, the code is run three times, each time with a new value used in the SOME_CONST initializer .
I ran this code three times, changing the SOME_CONST value each time. As you can see, there were no errors, and each execution was successful and produced the correct result.
This behavior stems from the nature of NodeJS - every time you run JavaScript code using it, it creates a new execution target, so there is no way to run the same code twice using the same execution target.
Sources and fulfillment funnels
When you look at JavaScript code, there are two main things you should focus on first.The first is sources , a term that describes all the points where user input meets application code. In the application's business logic, this could be an argument passed via GET in a URL, a cookie read by the application, or the contents of Local Storage.
The second is called an execution sink. This term refers to any JavaScript syntax element or HTML API function that executes the code passed to it as an argument. One obvious example is the JavaScript function eval(code_to_execute) , which evaluates (executes) the code passed to it as an argument. Another example is setTimeout(function_to_execute, timeout_in_milliseconds) , which executes the function passed as the first argument after a certain amount of time, specified by the second argument, has passed.
The process of detecting a vulnerability in a web application involves finding connections between a source and the execution sink that actually processes that source. In the example where I demonstrated how to use the debugger, the url argument (the source) was directly used in location.href (the execution sink). Another example would be a function that evaluates the data the user submitted to an HTML form input field (JavaScript can read it using a DOM API, such as document.getElementById('input_id').value , and assigns it to a variable, which in this case would be the source) and then passes this value to another element's innerHTML() method, updating the current DOM in the browser window (which would be the execution sink).
The author recommends the video , but it's in English. The gist of the video: there's user input, and there are functions in which it can be executed. Under certain conditions, this can be used maliciously—this is what causes a vulnerability, such as an arbitrary command execution vulnerability.
A web application can have a variety of execution sources and sinkholes depending on its business logic (form fields, URL parameters, cookies, browser storage, WebSockets, etc.). But the most important thing is whether they are used as execution sinkholes. There are a plethora of them, including location properties such as hash , window.open() , document.write() , or DOM methods such as innerHTML or appendChild . They can all be used to execute arbitrary code, perform redirects, or perform other types of injections.
To easily identify such source code patterns, I (meaning bl4de ) created the tool nodestructor . It inspects JavaScript files (both individual files and all JavaScript files in a directory specified as an argument), finding patterns that are well-known as execution sinkholes (or sources). Don't assume that every line of code found by nodestructor is immediately or easily exploitable—it all depends on what happens between the source and the execution sink (sanitization, encoding, parsing, data transformation into an object, string manipulation, etc.). The main goal of this tool is to provide an easy-to-use and fast way to find all patterns in large volumes of code.
Let's look at a quick example. First, we need a JavaScript file to analyze. The file I'm going to check is AppMeasurement.js from GM.com, which we saw earlier. I simply copy it from the browser (after first converting it to a readable format) and paste it into the code editor, then save it to my local storage in the /tmp folder.
In the terminal, I run nodestructor on the AppMeasurement.js file (with the -H option to also include searching for various HTML5 API patterns):
As you may have noticed, the tool identified a couple of potential execution sinkholes. Many of these are false positives, but for the purposes of this presentation, let's focus on the second one, which appears to be initializing the domain variable with the result of the location.hostname.toLowerCase() function .
It would be nice to be able to follow all occurrences of this variable in a file to determine whether it is subsequently used as an execution sink. You can use Studio Code's built-in functions, such as Find all references, or simply search for the domain string.
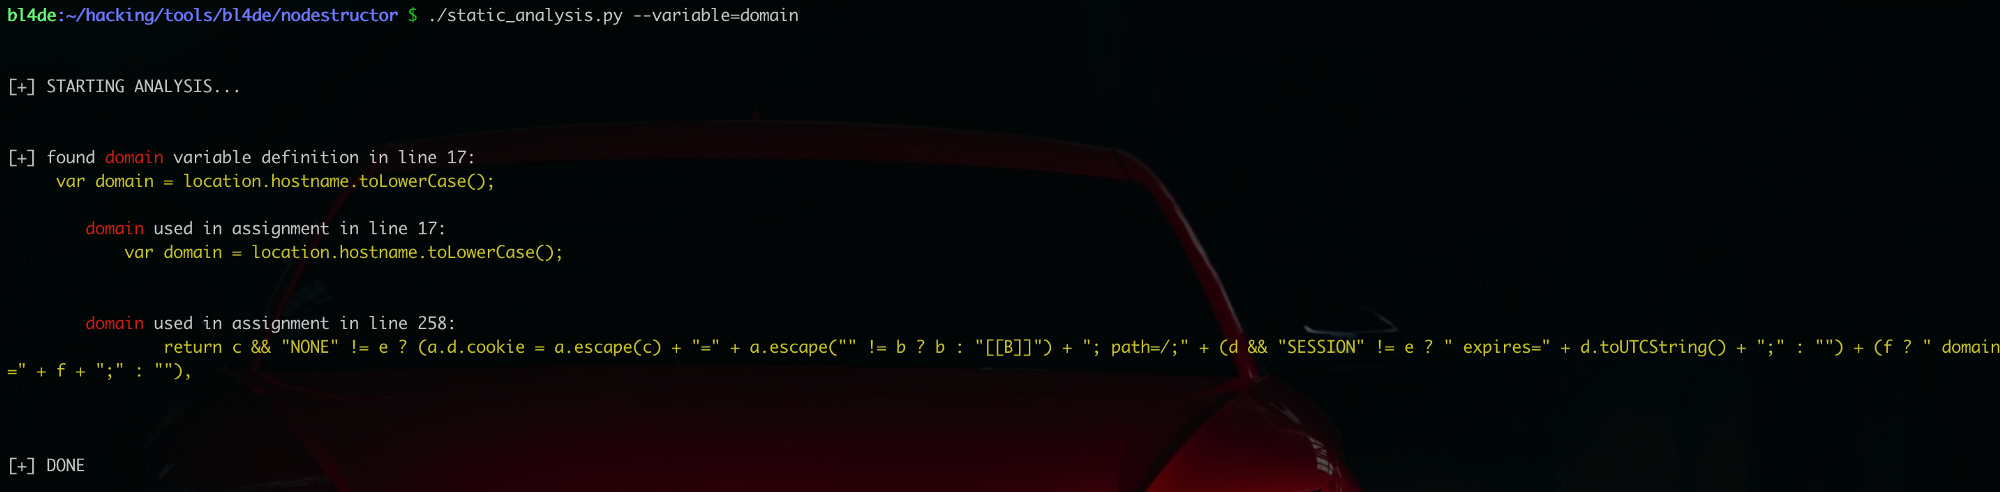
The author is working on another tool that isn't yet ready, but is intended to automate the described task. The result of the analysis to determine the use of the domain variable :
In the future, the author hopes to make this tool capable of performing more complex analysis, such as finding the use of a variable across different execution scopes (for example, if it is passed as an argument to a function or is actually used as an argument to any execution funnel).